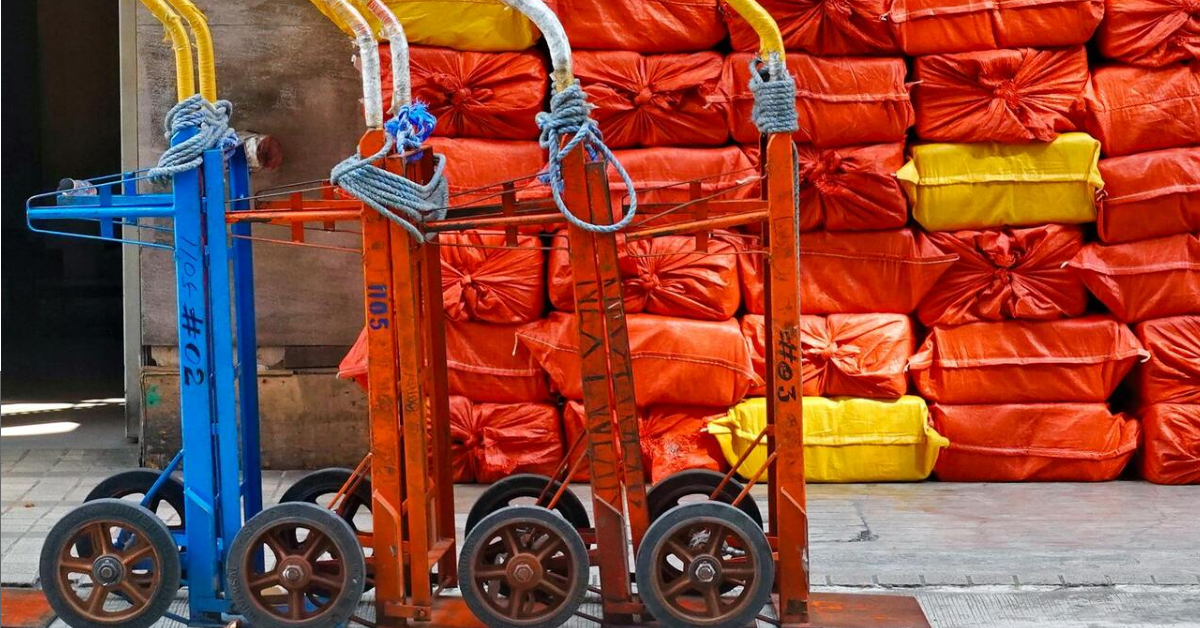
Selecting the correct cylinder trolley an important operational decision that has major implications for all areas of your business.
Safety, efficiency, and budget allocation are the priorities. An inadequate choice, often based on simplistic criteria like purchase price, is what exposes an organization to significant risk.This article presents a data-driven approach for benchmarking cylinder trolleys. The framework should help empower procurement and safety managers to move beyond superficial comparisons and make evidence-based selections.
The imperative of data-driven cylinder trolley benchmarking
Before looking at the metrics, we need to look at our methodology. Without a structured evaluation process, organizations default to anecdotal evidence or price-point decisions. Again, this leads to a mismatch between equipment and application. This is a huge problem in increasing the risk of musculoskeletal disorders (MSDs), as well as non-compliance with manual handling regulations. It can also escalate to long-term costs due to premature equipment failure and maintenance. A systematic approach based on quantifiable metrics for cylinder handling trolleys is the only effective methodology here.
Metric 1: A granular load capacity comparison
A manufacturer’s stated maximum load capacity is a baseline – rarely is it the complete picture. A thorough load capacity comparison should differentiate between static load capacity (at rest) and dynamic load capacity (in motion). These are very different, particularly on inclines where gravitational forces increase strain on the chassis and wheel assemblies.
So, it’s important to request load test certifications that specify the actual conditions of the test, including any gradient, and to scrutinize any of the design’s failure points. Are the welds on the axle supports the weak link, or is it the retention chain’s anchor point? A trolley rated for 200kg on a flat surface may be dangerously unstable when handling the same load on a 10% ramp, but this analysis needs to be done on a case-by-case basis.
Metric 2: Assessing trolley durability metrics
Durability is something that is heabvily influenced by the operational environment. The primary material is a key indicator, though. So, in environments with chemical exposure, 316-grade stainless steel offers better corrosion resistance than the more common 304 grade or standard powder-coated steel.
Request specific trolley durability metrics too, such as ASTM B117 salt spray test results. These help quantify the hours until the corrosion appears. You should also be careful around the quality of fabrication – poor welds are common points of catastrophic failure under stress.
Metric 3: Quantifying ergonomic handling standards
Effective ergonomic design is more quantifiable than many appreciate, and it directly impacts user safety. The primary ergonomic handling standards to measure are push/pull forces and user posture. This is done with a force dynamometer to measure the initial (static) and sustained (dynamic) force that is required to move a fully loaded trolley across floor surfaces that you expect in the future workflow. If outside, a variety of weather conditions must also be considered.
These figures should be well within the limits defined by HSE guidelines (such as below 20-25kg of sustained force for males). Handle height is how you quantify whether neutral posture is maintained – the optimal range is typically between 91cm and 119cm. Wheel selection too, where the larger diameter wheels and specific materials like polyurethane can reduce rolling resistance on uneven surfaces compared to solid rubber. This, of course, lowers the required push/pull force and reducing MSD risk.
Metric 4: The total cost of ownership
The purchase price is only the beginning when it comes to the total cost of ownership (TCO). A comprehensive cost analysis needs far more details. The TCO can be calculated as TCO = Initial Acquisition Price + (Annual Maintenance & Repair Cost x Expected Service Life in Years). This standardizes an overall, total cost, that is now far more ready for comparison.
To source this data, you will need to demand a list of common replacement parts, like wheels and bearings, and their costs from the manufacturer. You can inquire about the expected service life of each part, and whether performance data, such as mean time between failures (MTBF), is available for critical components. This calculation often shows that cheaper units are a false economy.
Building your comparison matrix & scoring template
Now you have collected and begun to process the data, it’s time to construct a comparison matrix. List potential trolley models in the rows and the core metrics in the columns:
- Dynamic Load Capacity (at specified incline)
- Material/Corrosion Rating
- Measured Push/Pull Force
- Handle Height
- 3-Year TCO
To formalize the decision, implement a weighted scoring system, like an index. Percentage weights are attributed to each metric based on your organization’s priorities. So in a high-risk environment, you might use this weighting:
- Ergonomic/Safety Factors (45%)
- Durability (30%)
- TCO (25%)
Scoring each model against these weighted criteria can help remove subjective bias, though there is an element of subjective judgment over the priorities and weightings.
A data-centric cylinder trolley benchmarking process is by far the most objective, results-focused strategy for ensuring a safe and economical procurement outcome. Just like customer service metrics, safety and ergonomics can be quantified.


