

Ecommerce

By Andy Taylor
This post was coauthored by Mark Ballard and Andy Taylor.
As marketers know all too well, Black Friday and Cyber Monday are now full-funnel, multi-channel, multi-screen events that require a comprehensive strategy to maximize effectively. Not only that, but the period that brands need to consider as part of this important stretch now starts well before the turkey gets carved on Thanksgiving Day.
Looking at same-store samples from the more than $4 billion in annual ad spend under management at Tinuiti, we’ve uncovered high-level takeaways from across the digital landscape to help inform the rest of your Q4. Here you’ll find data-backed insights across search, social, display, streaming, and commerce media.
Table of Contents
- The Top Black Friday & Cyber Monday (BCFM) Trends of 2025
- How Did the Holiday Weekend Impact Amazon Sponsored Products Sales Growth?
- How Much Did Amazon DSP Investment Grow Year Over Year?
- How Did Clicks and CPC Trend for Walmart Advertisers Ahead of Black Friday?
- How Did Average Order Value Trend for Google Advertisers on Black Friday and Cyber Monday?
- How Did Key Players like Amazon, Walmart, Temu, and Shein Approach Google Shopping Auctions?
- Which Device Types Were the Most Important for YouTube Advertisers?
- Did Facebook and Instagram CPM Growth Firm Up in the Weekend After Thanksgiving?
- How Much Did Reels Video Ads Impression Share Go Up Compared to Last Year?
- Were Advantage+ Shopping Campaigns More or Less Important for Meta Advertisers This Year?
- Have Advertisers Finally Shaken Off Concerns Over TikTok’s Future in the US?
- Why Did Reddit Spend Surge From Thanksgiving through Cyber Monday?
Overview: The Top Black Friday & Cyber Monday (BCFM) Trends of 2025
We dove deep into the ad spend trends that defined one of the biggest retail events of the year. During our research, we found a few standout trends regarding where advertisers invested their ad dollars this year:
- Brands continue to see strong growth in sales attributed to Amazon ads, and are leaning into the DSP to help further reach shoppers during key holiday shopping days
- Walmart advertising provides brands with a massive opportunity to influence not only digital but also in-store purchases
- While AI platforms might be growing in popularity, there’s still massive opportunity that’s only growing on traditional search engines like Google to reach holiday shoppers
- YouTube is a golden opportunity to reach shoppers, not only on laptops and phones but also on TV screens
- Meta advertisers continue to benefit from newer placements and tools like Reels and Advantage+
- TikTok spend is rising as advertisers are more confident in TikTok’s staying power in the US, particularly in the rush to reach holiday shoppers
- Brands are leaning into Reddit for its unique audience and pipeline to AI citations
This year, we saw Amazon Sponsored Products sales surge between Thanksgiving and Cyber Monday. In 2024, Amazon pulled its Black Friday deal messaging out a full week before Thanksgiving, resulting in advertisers seeing the strongest growth in sales attributed to ads in the week before Thanksgiving and slower growth over the weekend and into Cyber Monday. That trend was reversed in 2025, with sales attributed to Sponsored Products growing more than 30% from Saturday through Monday. Sales growth from the week before Thanksgiving through Black Friday was still strong, but slower than what was observed from Saturday onward.
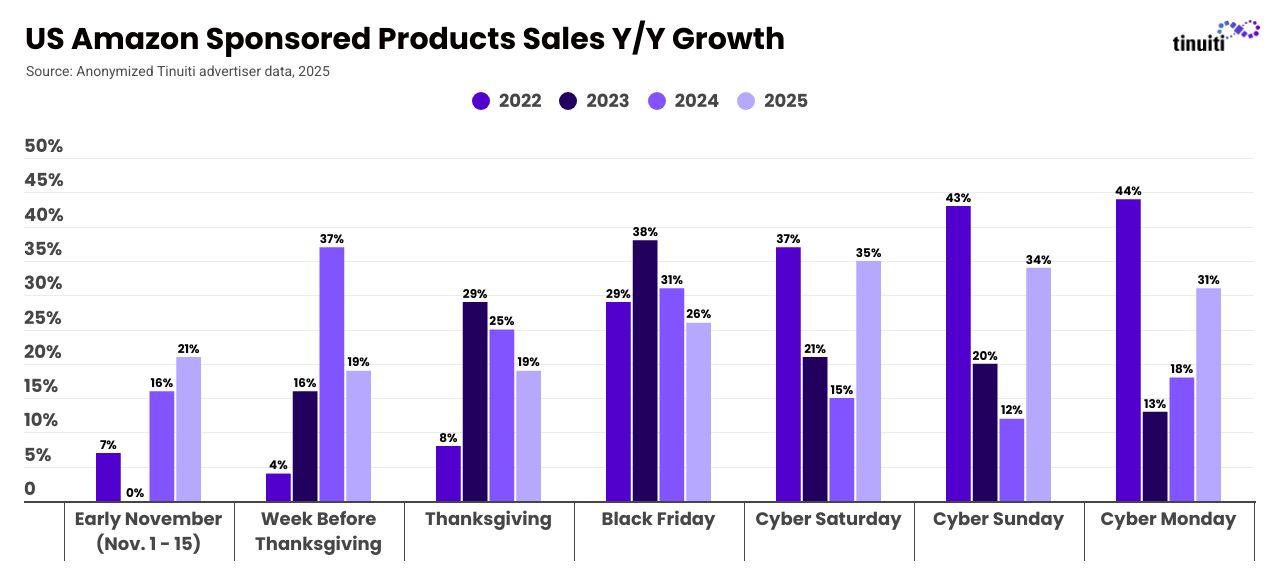
This reversal can be attributed at least partially to the strength of year-ago comparisons, with days that saw stronger growth last year slowing in 2025 and vice versa. The two-year average growth of every period from the week before Thanksgiving through Cyber Monday was between 22% and 28%, as shoppers have ramped up ad-attributed buying on Amazon throughout the nearly two-week period.
Beyond the Ad Console, advertisers also leaned into the Amazon DSP to reach shoppers during this important stretch of holiday shopping.
How Much Did Amazon DSP Investment Grow Year Over Year?
Brands advertising through the Amazon demand-side platform ramped up spending 34% year over year, with a 40% increase in impressions and 4% decline in CPM. Advertisers use the Amazon DSP to secure placements both on Amazon’s app/website as well as across the web.
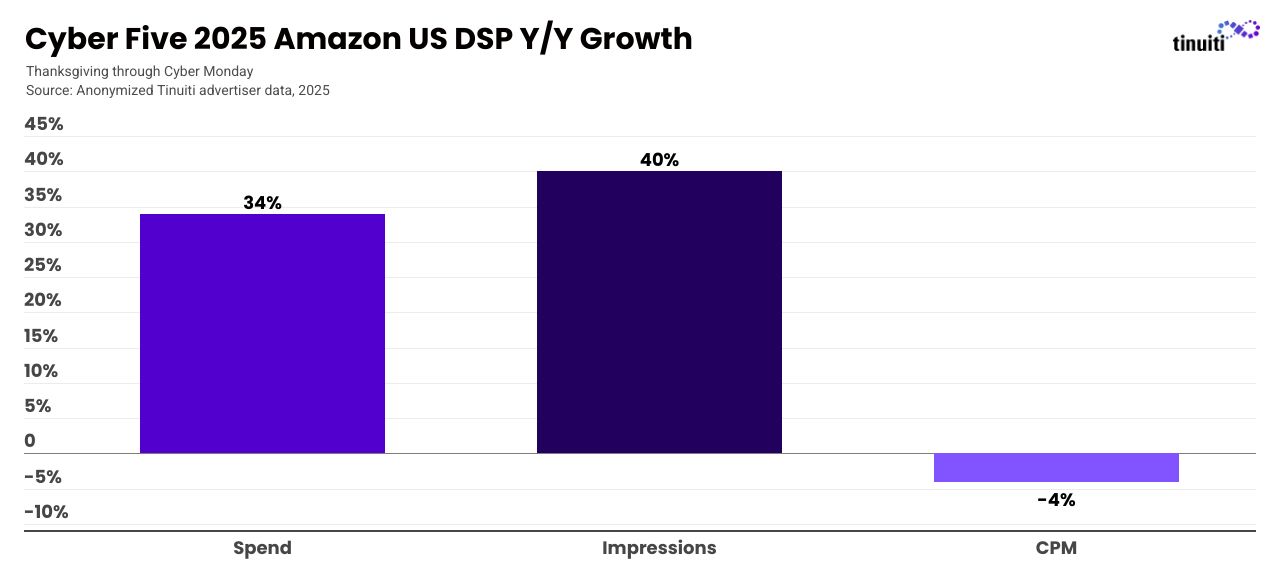
Amazon DSP spend growth has outpaced that of Ad Console campaign types for the last several years, and brands currently active on the DSP and Ad Console spent 31% of all Amazon investment on the DSP during the Cyber Five period.
Helping to drive up DSP spend has been the popularity of Prime Video ads, which have been adopted by both endemic and non-endemic advertisers alike. Across all advertisers, including those that didn’t advertise on Prime Video last year, investment in Prime Video ads jumped an astounding 650% year over year for the period between Thanksgiving and Cyber Monday.
How Did Clicks and CPC Trend for Walmart Advertisers Ahead of Black Friday?
Clicks on Walmart Sponsored Products ads started to really pick up in the middle of November, and over the week before Thanksgiving averaged 63% higher than November 1. Volume dipped temporarily on Thanksgiving before surging into the weekend, with Sunday and Monday seeing more than 175% more clicks than November 1.
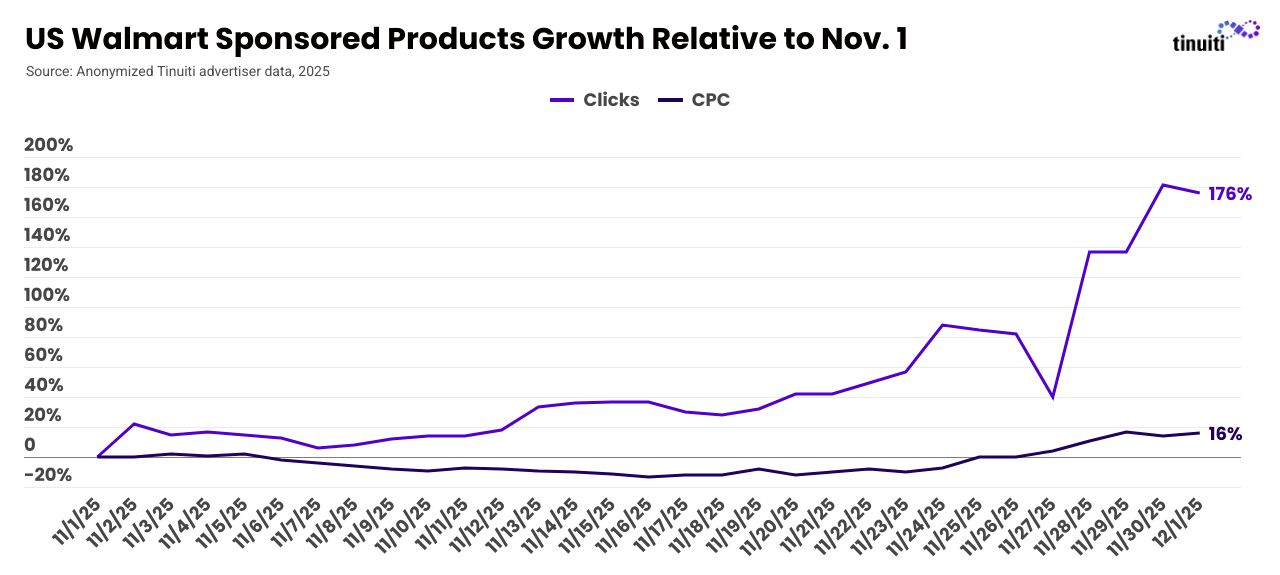
The cost of ad clicks rose during the crucial period between Thanksgiving and Cyber Monday as competition in ad auctions heated up, with daily CPC averaging 12% higher over that five day stretch than the beginning of November.
How Did Average Order Value Trend for Google Advertisers on Black Friday and Cyber Monday?
Retailer sales generated by Google search ads, including Performance Max, standard Shopping, and text ad campaigns, were up 8% year over year to start the fourth quarter, but growth accelerated into November and the run up to the Cyber Five period.
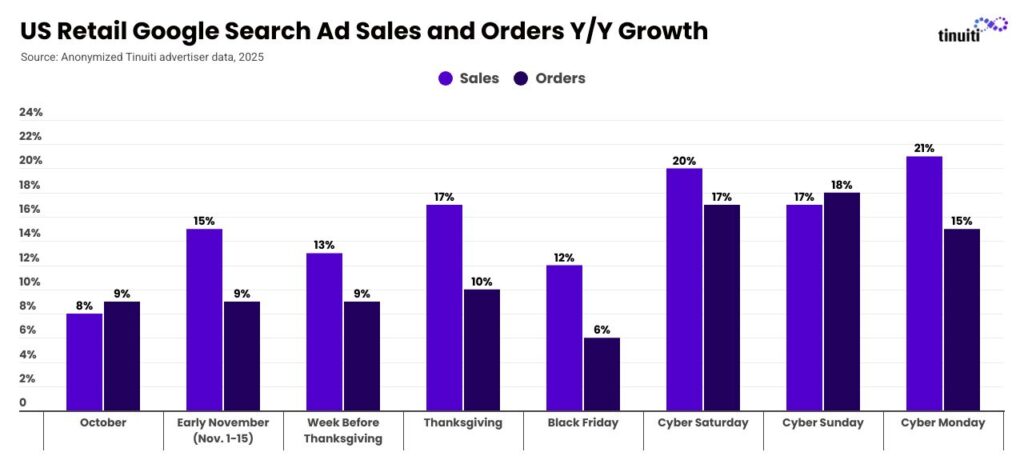
Retail Google search ads sales were up 15% year over year in early November and 13% during the week before Thanksgiving. That rate jumped to 17% on Thanksgiving itself before sliding to 12% on Black Friday. While Black Friday and Cyber Monday remain the biggest sales days of the period, customers have come to expect holiday deals to last throughout Cyber Week, if not beyond, and have spread out their purchases as a result.
Cyber Saturday through Monday saw particularly strong order growth for Google search ads with retailer orders up 17% on Saturday, 18% on Sunday, and 15% on Monday. All told, retail sales from Google search ads were up 20% on Saturday, 17% on Sunday, and 21% on Monday.
In general, the average order value for Google search ads has also run higher year over year since early November, with Cyber Sunday as the lone exception during the Cyber Five.
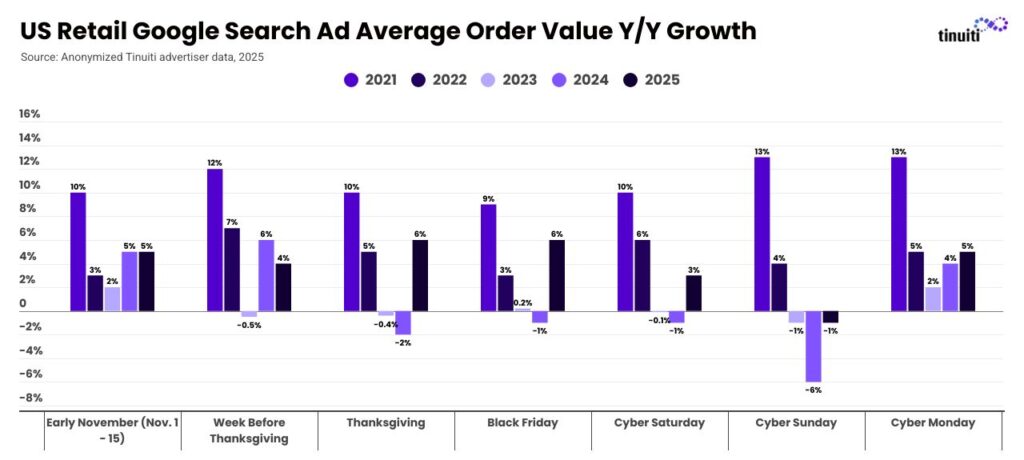
The average order value from Google search ads was up by an average of 4% year over year for retailers from Thanksgiving through Cyber Monday in 2025. In 2024, AOV fell for most of the Cyber Five, with an average decline of 1% year over year.
Amazon remained notably absent from Google shopping ad listings during the Cyber Five, having withdrawn from Google shopping auctions in late July. Amazon had paused its Google shopping ads a few times in previous years, including during the early days of the pandemic, but this current break is now Amazon’s longest.
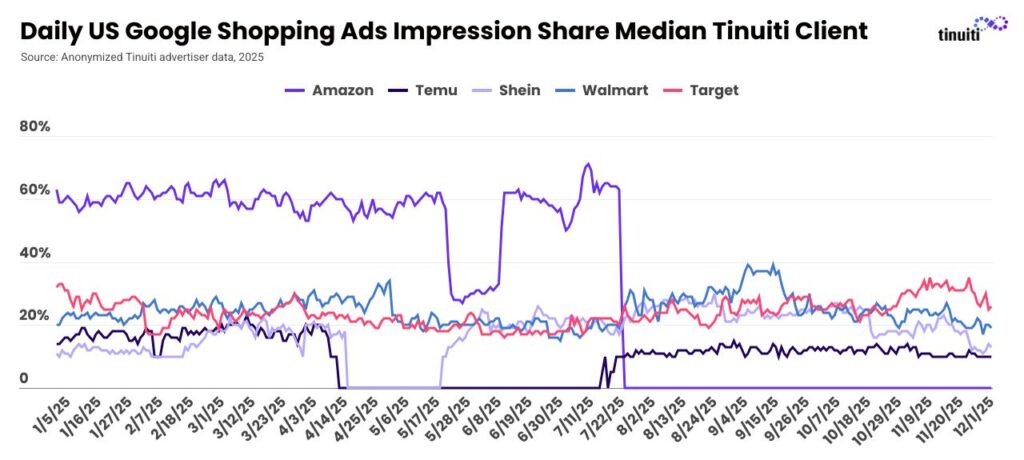
Temu and Shein also paused their Google shopping ads earlier in 2025, as tariff rates on Chinese goods skyrocketed and the de minimis exception on those goods was set to expire, but both have been active throughout Q4.
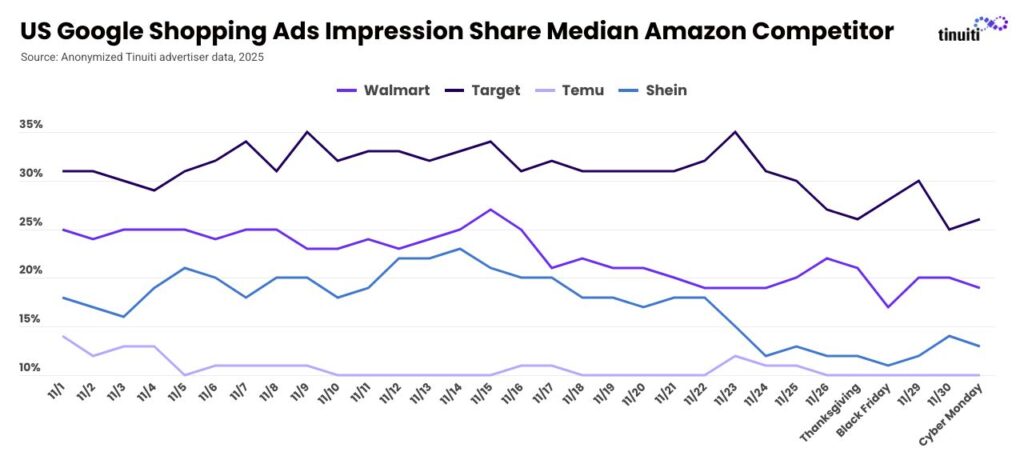
Zooming in on just the past month of results, it doesn’t appear that Temu, Shein, or Walmart or Target, for that matter, made a particularly big push to fill the gap Amazon left in Google’s shopping listings during the Cyber Five though. All saw their share of Google shopping impressions running at least slightly lower from Thanksgiving through Cyber Monday than it did over the first week of November.
Which Device Types Were the Most Important for YouTube Advertisers?
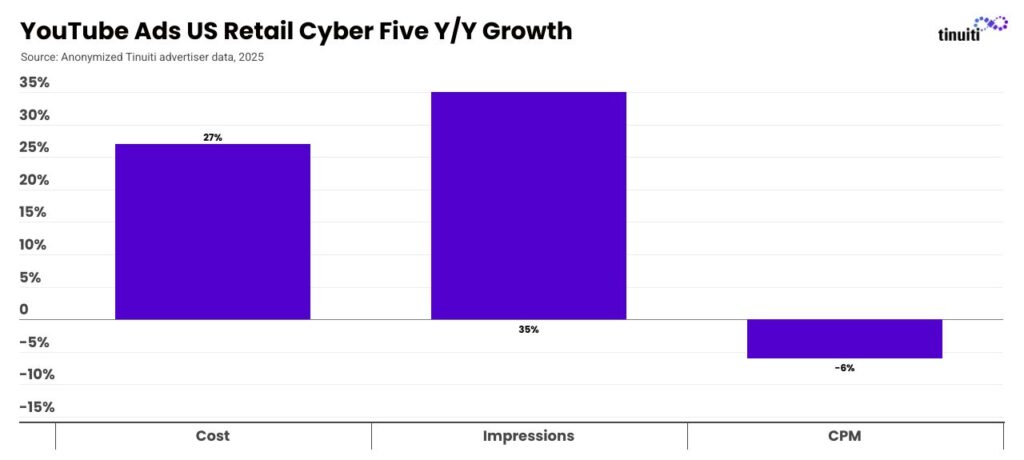
Retailer spending on YouTube ads was up 27% year over year during the Cyber Five period from Thanksgiving through Cyber Monday, with impressions up 35% and average CPM falling 6%.
Particularly for retailers, Google Demand Gen campaigns have become a major vehicle for purchasing YouTube inventory as Google began transitioning Video Action Campaigns to Demand Gen campaigns automatically in July 2025.
The difference in use between Demand Gen and traditional video campaigns for YouTube inventory (more action vs. more awareness) is reflected in the devices generating spending for each:
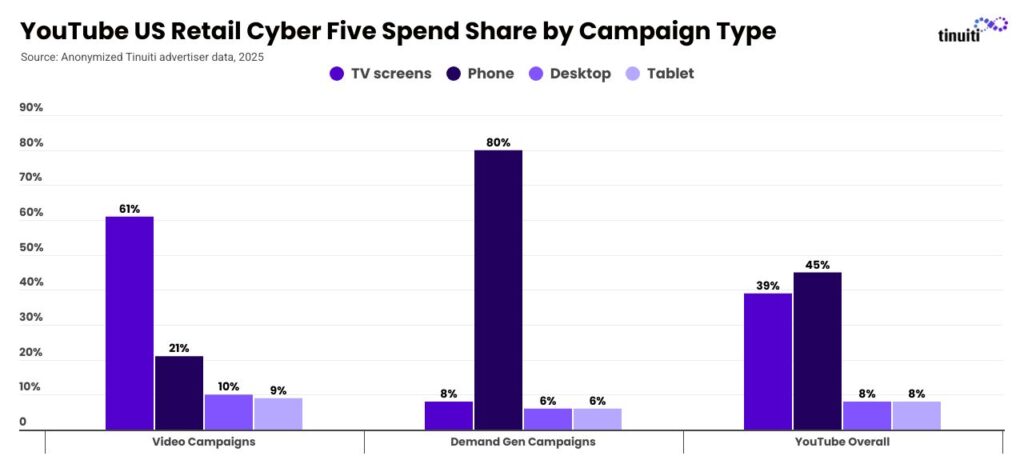
During the Cyber Five, TV screens accounted for 61% of retailer YouTube spending through video campaigns, but just 8% of YouTube spending through Demand Gen campaigns. On the flip side, phones accounted for 80% of Demand Gen spending on YouTube inventory, but just 21% of video campaign spending.
In the seven days leading up to Thanksgiving, CPM on Meta was down 13% year over year, with double-digit declines on both Facebook and Instagram. Pricing started to heat up on Thanksgiving, and from Saturday through Monday average daily CPM growth averaged just a 1% decline.
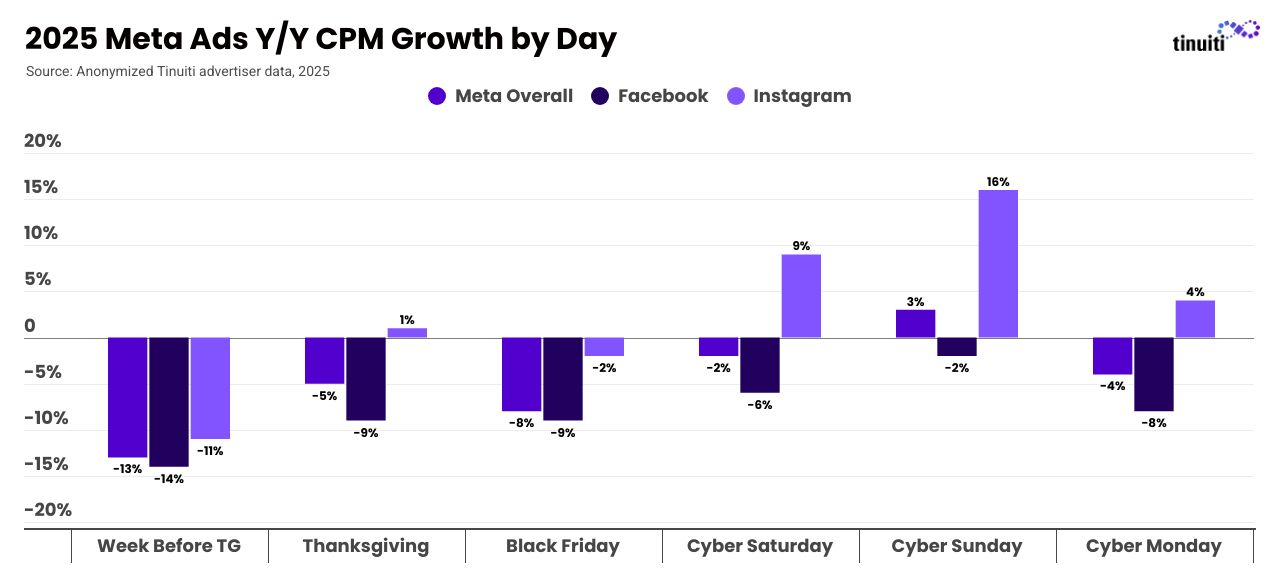
Naturally, not all advertisers saw CPM decline, and CPM rose for 37% of the Meta advertisers studied. With Instagram CPM growth far outpacing that of Facebook, part of what separates those brands that see positive pricing growth from those that see negative is the share of spend attributed to each platform.
CPM is also hugely impacted by the share of impressions coming from different placements, which has changed quite a bit since 2024.
How Much Did Reels Video Ads Impression Share Go Up Compared to Last Year?
Reels ads continue to become a more important part of how Meta advertisers reach Facebook and Instagram users during key holiday shopping days over the years. For the period from Thanksgiving through Cyber Monday, Reels video ads accounted for 28% of all Instagram ad impressions, up from 20% last year and equal to the share of impressions attributed to Feed ads.
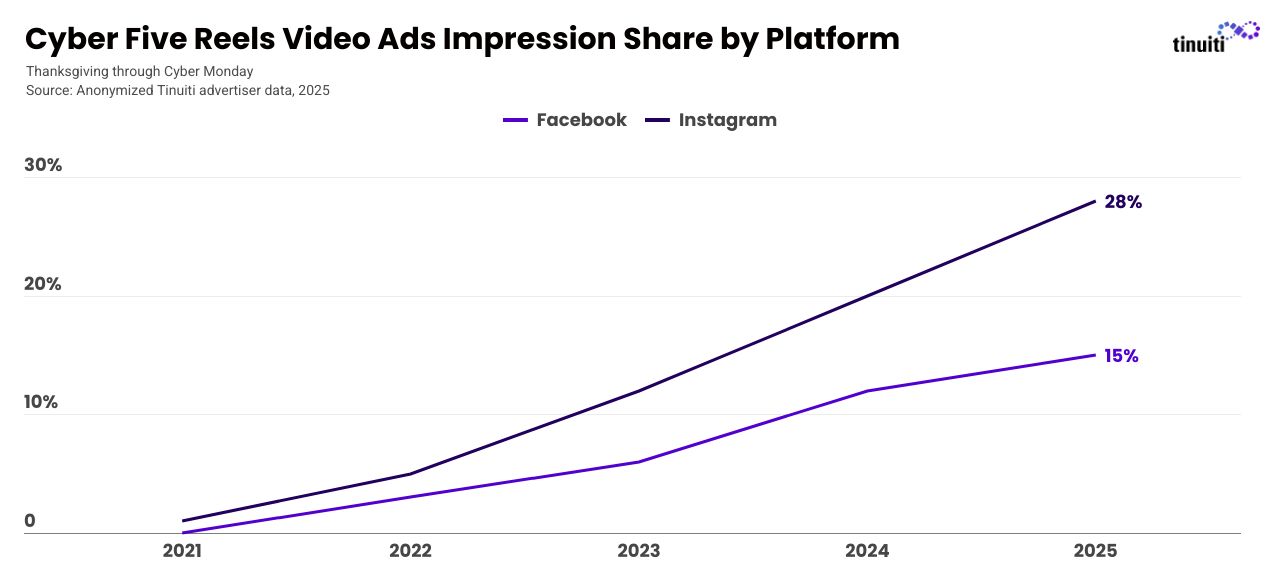
Reels video placements also accounted for 15% of Facebook ad impressions, up from 12% last year. This doesn’t include Ads on Facebook Reels, which are banner ads shown on Reels and accounted for 13% of Facebook ad impressions, or in-stream ads for Reels, which accounted for 4% impression share. Neither of these placements are available on Instagram, highlighting even more runway for Reels-related inventory to grow from here.
With Facebook and Instagram Reels CPM lagging that of more mature placements like Feed and Stories, the growth of these ads continues to put downward pressure on pricing.
Were Advantage+ Shopping Campaigns More or Less Important for Meta Advertisers This Year?
In 2024, Advantage+ shopping campaigns accounted for 26% of all Meta retail and ecommerce spend between Thanksgiving and Cyber Monday. That share rose to 33% in 2025, as advertisers continue to lean into the AI-powered campaign type that streamlines some aspects of campaign optimization.
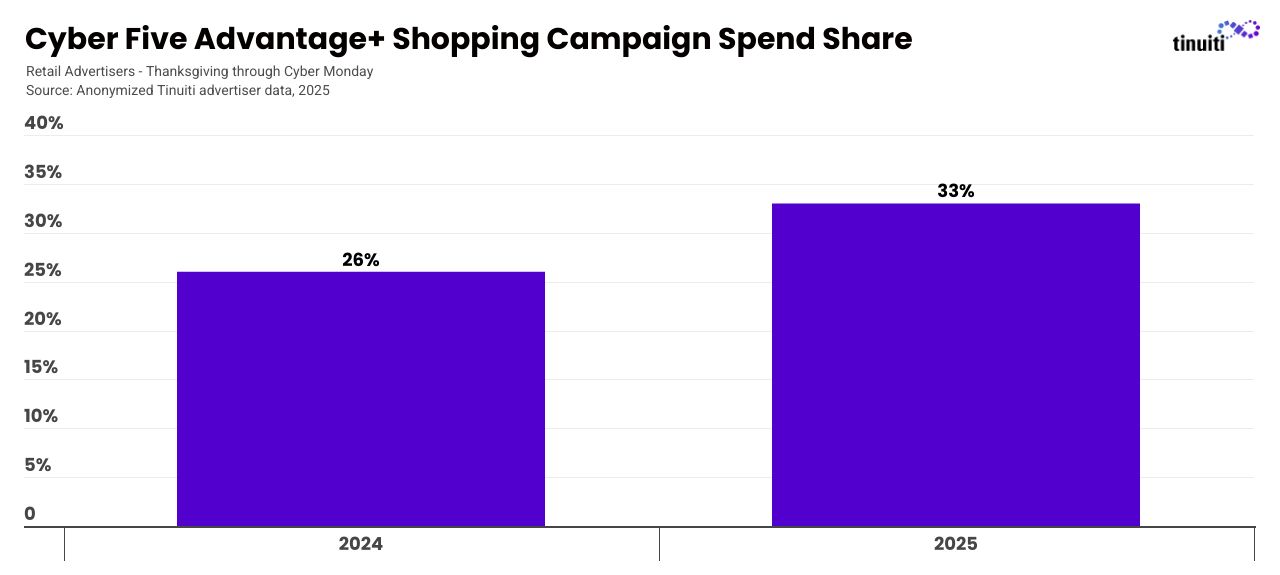
The 33% share of retail spend attributed to ASC is also an uptick from the 27% share observed in Q3 2025. AI-powered campaign types are also becoming a bigger part of how advertisers reach shoppers on other social platforms like TikTok.
Have Advertisers Finally Shaken Off Concerns Over TikTok’s Future in the US?
The median advertiser active on TikTok both this year and last year spent 22% more year over year during the period between Thanksgiving and Cyber Monday. This marks a significant rebound from the spend growth observed in recent quarters, as advertisers were hesitant to spend big on the platform earlier in 2025 amid concerns about its future in the US.
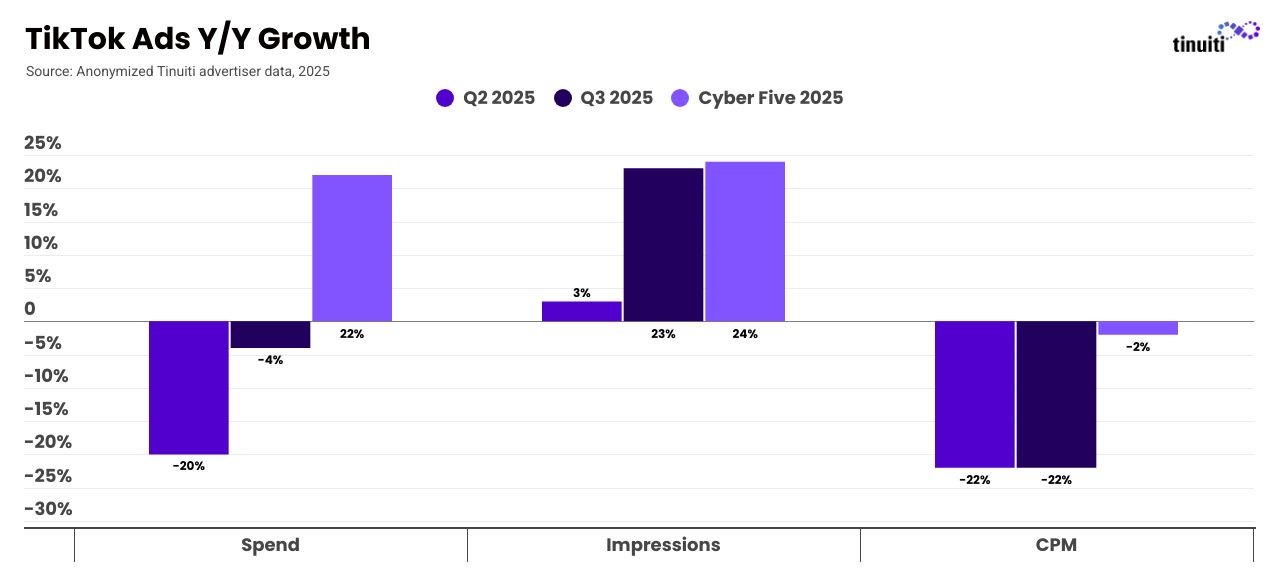
Notably, CPM fell just 2% year over year over the course of the Cyber Five, a significant rebound from the 22% decline observed in both the second and third quarters.
TikTok advertisers are increasingly using Smart+ campaigns, similar to Meta’s Advantage+ campaigns, to drive performance on the platform. In the third quarter, Smart+ accounted for 42% of all performance TikTok investment for Tinuiti advertisers.
Why Did Reddit Spend Surge From Thanksgiving through Cyber Monday?
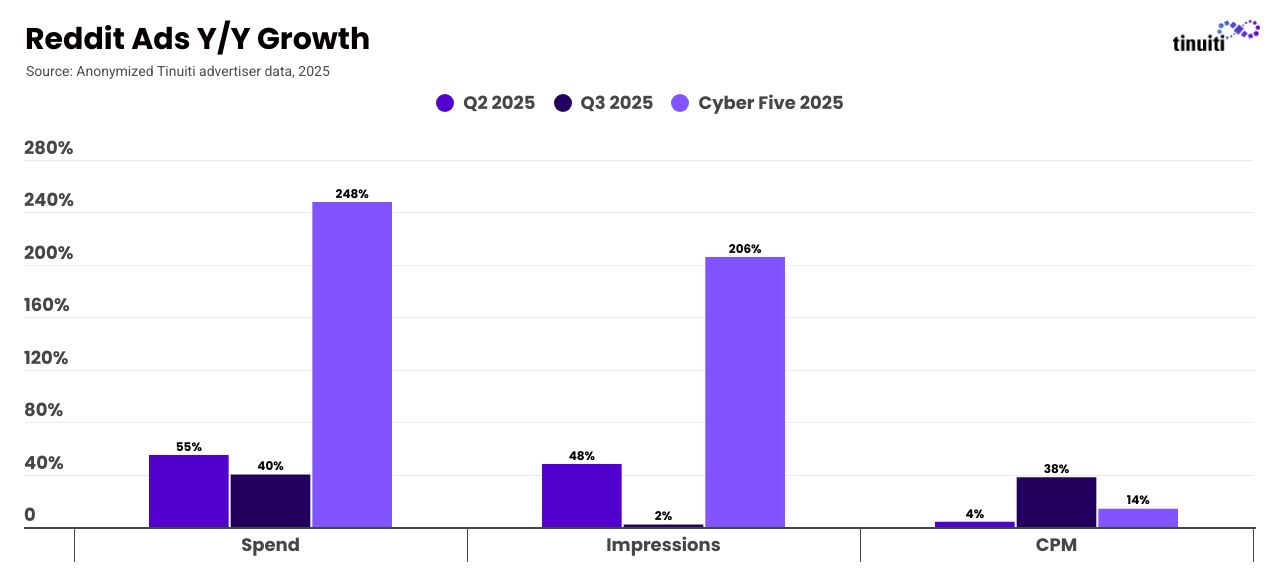
The median same-store Reddit advertiser increased spend on the platform by 248% over the course of the Cyber Five, with a 206% increase in impressions and 14% increase in CPM. This represents a massive acceleration from the already strong 55% and 40% spend growth rates observed in the second and third quarters of 2025.
Advertiser interest in Reddit is strong not only for the incremental reach it has with audiences that may not be active on other social platforms, but also for its inclusion in AI citations. Tinuiti’s 2025 Holiday Shopping Trends study found that 58% of holiday shoppers expect to use at least one AI-powered tool for holiday-shopping-related tasks.
Conclusion
While Black Friday and Cyber Monday are officially over, there are still plenty of opportunities left for marketers looking to make the most of the holiday shopping season. See how your brand stacks up to the trends outlined above and use those learnings to end 2025 on a high note while setting the stage for success in 2026. If you’re looking for more customized advice for your brand, don’t hesitate to contact us today.
Wondering what’s next in 2026?
If you’d like to stay a step ahead of the competition, check out our newest Big Bets for the CMO report. We’ll reveal how AI, data, and – of course, humans – will redefine performance in the year ahead.
You Might Be Interested In