


Quick Decision Framework
- Who This Is For: Shopify founders and DTC operators between $200K and $5M in annual revenue who are working hard but not growing as fast as they expected, and who suspect their attention is spread too thin.
- Skip If: You are in your first 90 days of launch and still testing products, channels, and offers. At that stage, your constraint is information, and the right move is to gather it quickly across multiple experiments.
- Key Benefit: A repeatable diagnostic framework for identifying the single bottleneck holding your store back, and a clear method for picking the one metric that, if moved, would unlock everything else.
- What You’ll Need: Access to your Shopify analytics, a basic understanding of your current traffic, conversion, and retention numbers, and 45 minutes of uninterrupted thinking time.
- Time to Complete: 15 minutes to read. 45 minutes to run the bottleneck diagnostic on your own store.
Every system has exactly one constraint that limits its output. Fix that constraint and the whole system improves. Fix anything else and nothing changes.
What You’ll Learn
- Why working on five priorities at once produces slower results than working on one, and the science that explains it.
- How to diagnose which of the four core bottleneck categories is actually limiting your Shopify store’s growth right now.
- What the One Metric That Matters (OMTM) framework is, and how to pick the right one for your current revenue stage.
- How to communicate a single priority to your team so that everyone’s work compounds in the same direction.
- When to rotate your constraint focus and how to know your current bottleneck has been resolved.
A founder I spoke with last year was running a Shopify store doing $800K annually. She had a good product, a loyal core customer base, and a team of four. She was also running paid ads on Meta, testing TikTok Shop, trying to get her email flows rebuilt in Klaviyo, negotiating with a new supplier, and exploring a wholesale channel a retailer had pitched her on. Every single one of those things was a legitimate opportunity. None of them was getting enough attention to produce a real result. Her store had grown 12% in the previous 12 months. The year before that, it had grown 40%.
When I asked her what her biggest constraint was, she said: “I don’t know. Everything feels broken.” That answer told me exactly what was wrong. Not with her business, but with her operating system. She had stopped asking the most important question in growth: what is the one thing, if I fixed it, that would make everything else easier or unnecessary?
This piece is about that question.
It is the natural companion to the idea of saying no to almost everything that does not matter. That piece is about subtraction. This one is about sequencing. Once you have cleared the noise, you still need to know what to do first. And the answer is almost never what founders think it is.
The Science Behind Single Priority Focus
In 1984, a physicist and management consultant named Dr. Eliyahu Goldratt published a business novel called The Goal. The central argument was deceptively simple: every system, whether a manufacturing plant or a Shopify store, has exactly one constraint at any given moment that limits the output of the entire system. He called this the Theory of Constraints. The insight that made it revolutionary was not the idea of constraints themselves. It was the corollary: improving anything other than the constraint produces zero improvement to the system as a whole.
Think about that for a moment. If your store’s growth is limited by a 1.2% conversion rate, and you spend six months improving your email flows, your email performance will improve. But your revenue will not grow proportionally, because the constraint is still the conversion rate. Every visitor who would have converted at 1.2% still converts at 1.2%. The email work was not wasted. It just was not the lever. And in a business with finite time and capital, working on the wrong lever is not neutral. It is expensive. You can read more about how the Theory of Constraints applies specifically to ecommerce companies and why so few operators have actually internalized it.
The parallel framework that emerged from Silicon Valley is called the One Metric That Matters, or OMTM. Alistair Croll introduced it in his 2013 book Lean Analytics. The premise is identical to Goldratt’s, expressed in startup language: at any given stage, there is one metric that, if significantly improved, would have the biggest impact on your growth. Everything else is noise until that metric moves. The brands that grow fastest are not the ones tracking the most metrics. They are the ones who have identified the one metric that unlocks the next level and have organized their entire team around moving it.
The data from the Shopify ecosystem confirms this pattern. Research consistently shows that over 60% of Shopify stores never scale past $20K per month, even when they have products that sell, traffic that converts, and customers who return. The bottleneck is almost never the product. It is almost always diffusion: founders spreading their limited resources across too many parallel improvement tracks, none of which gets the sustained focus required to produce a compounding result.
The Four Bottleneck Categories
Every Shopify store’s growth constraint falls into one of four categories. The diagnostic is not complicated, but it requires honesty about where your numbers actually sit relative to benchmarks. Most founders skip this step because they already have a theory about what is wrong. The theory is usually based on what they most recently heard about at a conference or saw another brand doing. It is rarely based on their own data.
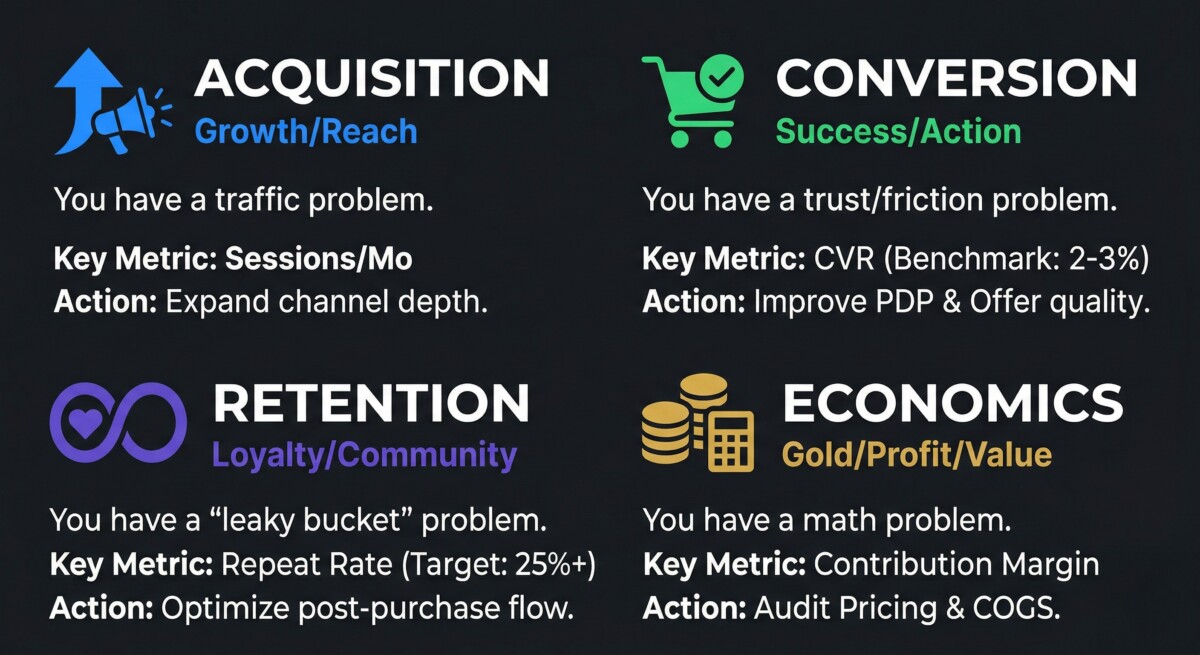
The first category is acquisition. Your store has a traffic problem. Not enough of the right people are finding you. This is the constraint when your conversion rate is at or above the 2 to 3% benchmark for DTC ecommerce, your repeat purchase rate is healthy, and your average order value is reasonable, but your total revenue is limited by the volume of visitors arriving at the top of the funnel. Throwing more money at ads without fixing this constraint first is exactly what founders do. But if your unit economics are broken, more traffic just means more losses at scale.
The second category is conversion. Your store has a convincing problem. Traffic is arriving but not buying. This is the constraint when your sessions are strong but your conversion rate sits below 1.5%, your add-to-cart rate is reasonable but checkout abandonment is high, or your product pages are generating interest but not purchase intent. The math on conversion is the most compelling in all of ecommerce: going from a 1.5% to a 2% conversion rate on 50,000 monthly sessions is 250 additional orders per month with zero additional ad spend. For a full breakdown of the levers that move this number, the ecommerce conversion rate optimization guide covers the 16 highest-impact tactics with real benchmarks at each stage.
The third category is retention. Your store has a loyalty problem. You are acquiring customers but not keeping them. This is the constraint when your repeat purchase rate sits below 25%, your customer lifetime value is low relative to your customer acquisition cost, and your revenue is heavily dependent on new customer acquisition to hit monthly targets. Brands in this position are running on a treadmill: spending to acquire, failing to retain, spending again. The economics never improve because the unit economics never close. The average DTC brand doing over $500K in revenue gets 35% to 45% of that revenue from returning customers. If your number is materially below that range, retention is your constraint.
The fourth category is economics. Your store has a margin problem. Revenue is growing but profitability is not. This is the constraint when your contribution margin per order is too thin to fund growth, your cost of goods has crept up without a corresponding price adjustment, your return rate is eroding realized revenue, or your customer acquisition cost has risen faster than your average order value. Brands in this category often look healthy from the outside and are quietly running out of cash. The constraint is not growth. It is the unit economics that growth is built on.
Why Working on Five Things Produces Less Than Working on One
This is the part that founders resist most, because it feels counterintuitive. If I have four bottlenecks, surely I should be working on all four simultaneously. The answer, both from the Theory of Constraints and from the practical experience of watching hundreds of Shopify brands scale, is no. And the reason is not about bandwidth, though bandwidth is real. It is about the nature of systems.
A system’s output is determined by its weakest link. If your conversion rate is 1.2% and your retention rate is 28% and your acquisition is generating 40,000 sessions per month, the output of the whole system is capped by the conversion rate. Improving retention from 28% to 35% while conversion stays at 1.2% produces a smaller gain than improving conversion from 1.2% to 2% while retention stays at 28%. The math is not close. The conversion improvement compounds through every session, every campaign, every dollar of ad spend. The retention improvement only compounds through existing buyers.
There is also a focus premium that gets lost when attention is divided. A team that is working on conversion exclusively will identify and test things that a team splitting time across four priorities will never reach. The depth of analysis, the speed of iteration, and the quality of hypotheses all improve when a single metric is the declared priority. Brands that run five parallel improvement tracks at 20% attention each do not produce five times the results of a brand running one track at 100% attention. In my experience watching this pattern play out, they produce about half the results, because no single track ever gets the sustained pressure required to break through.
The counterargument is always: “But what if we fix conversion and retention gets worse?” That is a real concern with a simple answer. You track the other metrics. You just do not optimize for them. The distinction matters. Monitoring is free. Optimizing is expensive. You watch everything. You improve one thing.
The OMTM by Stage: What to Focus on at Each Revenue Level
The right One Metric That Matters changes as your store grows. A brand doing $50K per month has a different constraint than a brand doing $500K per month. Getting this wrong is one of the most common and costly mistakes I see operators make, because the advice that circulates in ecommerce communities is almost never stage-specific. It is written for the median brand, which means it is wrong for most brands.
Under $500K in annual revenue
The constraint is almost always conversion or acquisition. At this stage, you do not have enough data to meaningfully optimize retention, and your economics are still being established. The OMTM for most stores in this range is conversion rate. Every percentage point of improvement compounds through everything else you do. If you are doing $300K annually with a 1.2% conversion rate and you improve to 2%, you are doing $500K with the same traffic and the same ad spend. That is not a marginal gain. That is a business transformation.
Between $500K and $2M annually
The constraint shifts. Most stores in this range have solved the conversion problem well enough to grow past the early stage. The new constraint is almost always retention. Your acquisition engine is working. Your conversion is reasonable. But your repeat purchase rate is low, which means you are paying to acquire customers who buy once and leave. The OMTM in this range is typically repeat purchase rate or, more specifically, the percentage of first-time buyers who make a second purchase within 90 days. Understanding what makes repeat customers so profitable and how the compounding effect of a second purchase changes your entire unit economics is the foundation of sustainable growth at this stage. Repeat buyers are worth 6 to 7 times more over their lifetime than one-time buyers. The second purchase is not just revenue. It is the beginning of a relationship that funds your acquisition indefinitely.
Above $2M annually
The constraint is most often economics or operational efficiency. Revenue is there. The challenge is making it profitable enough to fund the next stage of growth without raising capital or burning through cash reserves. The OMTM in this range is typically contribution margin per order or customer acquisition cost payback period. Brands that get here without strong unit economics are fragile. One bad quarter of ad performance, one supply chain disruption, one return rate spike can turn a healthy-looking revenue number into a cash crisis. The 11 key retention metrics that matter most at this stage give you the measurement framework to know whether your economics are compounding or eroding.
How to Find Your Constraint and Pick Your Metric
The diagnostic is a four-step process that takes about 45 minutes if you have your Shopify analytics open. Do not skip it. The founders who skip it are the ones who spend six months optimizing the wrong thing.
Step one: pull your last 90 days of Shopify data and write down four numbers. Your average monthly sessions. Your store conversion rate. Your repeat purchase rate (the percentage of orders from customers who have bought before). And your contribution margin per order, which is your average order value minus cost of goods, shipping, and payment processing fees. These four numbers tell you almost everything you need to know about where your constraint lives.
Step two: benchmark each number against the stage-appropriate targets. For sessions, the question is not a benchmark number but a trend: is it growing, flat, or declining? For conversion rate, the DTC benchmark is 2 to 3% for desktop, lower for mobile-heavy stores. For repeat purchase rate, the benchmark is 25 to 30% for the average DTC brand, 35 to 45% for consumables and subscription-adjacent products. For contribution margin, the minimum viable number is 30% to sustain paid acquisition. Below that, growth is a cash trap.
Step three: identify which number is furthest from its benchmark. That is your constraint. Not the number you most want to fix. Not the number that is most interesting to work on. The one that is furthest from where it needs to be relative to your stage.
Step four: translate the constraint into a single metric with a specific target and a 90-day timeline. “Improve conversion rate” is not a metric. “Increase store conversion rate from 1.3% to 2.0% by June 30” is a metric. The specificity is not administrative. It is what allows your team to know whether the work they are doing is connected to the goal or not.
The OMTM is not the metric you most want to improve. It is the metric that, if improved, makes everything else easier. Those are often different numbers.
Communicating the Single Priority to Your Team
The hardest part of the single priority framework is not identifying the constraint. It is holding the line on it when everything else is competing for attention. A new app gets pitched. A competitor launches something interesting. A supplier offers a deal that requires a quick decision. A customer asks for something that seems reasonable. Every one of these is a test of whether the priority is real or just a slide in a strategy deck.
The way to make it real is to make it visible and to connect every team member’s work explicitly to the metric. If the OMTM is conversion rate, then the developer’s sprint is about checkout flow. The copywriter is rewriting product page descriptions. The designer is testing new product imagery. The email marketer is building a browse abandonment sequence. Every role has a clear line from their current work to the number. When someone proposes a project that does not connect to the conversion rate, the question is not “is this a good idea?” The question is “does this move our OMTM?” If the answer is no, the project goes on a list for the next 90-day cycle.
This is where the Won’t Do list from the previous knowledge drop becomes operationally useful. The single priority framework tells you what to work on. The Won’t Do list protects the time and attention required to actually do it. Together, they create an operating system where focus is the default, not the exception. The brands that build this infrastructure early, when it is still relatively easy to implement, are the ones that look effortlessly disciplined from the outside. They are not more talented. They are more organized about what they will not do.
There is also a communication discipline worth naming. When you declare a single priority to your team, you need to revisit it visibly and consistently. A weekly check-in that opens with the OMTM number and closes with the question “what did we learn this week that changes how we approach this metric?” takes 15 minutes and creates more strategic alignment than any quarterly planning session. The number becomes the shared language. Progress becomes visible. The team starts to feel the momentum of moving a single metric in a single direction, which is a fundamentally different experience than the scattered feeling of working on many things at once and seeing none of them move.
When to Rotate Your Constraint Focus
The single priority framework is not a permanent operating mode. It is a 90-day sprint structure. The constraint you are working on today will eventually be resolved, or it will improve enough that a different constraint becomes the binding limit on your growth. Knowing when to rotate is as important as knowing what to focus on.
The signal that a constraint has been resolved is not perfection. It is sufficiency. If your conversion rate was at 1.2% and you have moved it to 2.1%, you have probably resolved the conversion bottleneck enough that it is no longer the primary limit on your growth. The question to ask is: if I improve this metric another 20%, does it unlock more growth than improving a different metric by 20%? When the answer shifts from your current OMTM to a different metric, that is the rotation signal.
The rotation cadence that works best for most Shopify brands in the $500K to $2M range is quarterly. Ninety days is long enough to run meaningful experiments and see real results. It is short enough that you are not locked into a wrong diagnosis for an entire year. At the end of each 90-day cycle, run the four-number diagnostic again. The constraint will have shifted. The OMTM should shift with it.
The mistake to avoid is rotating too early. Founders get bored. They see incremental progress and want to declare victory and move on. The discipline is to stay on the constraint until the benchmark is met, not until progress begins. Beginning to improve a metric is not the same as resolving the constraint. A conversion rate that moves from 1.2% to 1.6% is progress. It is not a resolved constraint. Stay on it until you hit the benchmark, then rotate.
Frequently Asked Questions
How do I figure out which bottleneck is actually limiting my Shopify store’s growth?
Pull your last 90 days of Shopify analytics and write down four numbers: monthly sessions, store conversion rate, repeat purchase rate, and contribution margin per order. Then benchmark each against stage-appropriate targets: 2 to 3% for conversion, 25 to 30% for repeat purchase rate, and 30% or higher for contribution margin. The metric that is furthest from its benchmark relative to your current revenue stage is almost always your primary constraint. Do not rely on intuition here. Founders consistently misidentify their constraint because they optimize for what feels urgent rather than what the data says is limiting.
What is the One Metric That Matters and how is it different from my regular KPIs?
The One Metric That Matters (OMTM) is the single number that, if significantly improved over the next 90 days, would have the largest impact on your store’s growth. It is different from your regular KPIs in one critical way: it is the number you are actively optimizing, not just monitoring. You track all your KPIs. You optimize only the OMTM. This distinction matters because optimizing requires sustained team attention, experimentation, and resource allocation. Trying to optimize five metrics simultaneously produces mediocre progress on all of them. Concentrating everything on one metric produces breakthrough results on that metric, which then lifts the others as a downstream effect.
What should my One Metric That Matters be at different Shopify revenue stages?
Under $500K annually, focus on conversion rate. This is the highest-leverage metric at early stage because it compounds through every session and every ad dollar. Between $500K and $2M, shift to repeat purchase rate, specifically the percentage of first-time buyers who return within 90 days. At this stage your acquisition engine is working, and the constraint is lifetime value. Above $2M, the OMTM typically shifts to contribution margin per order or CAC payback period, because the challenge becomes making growth profitable enough to sustain without external capital. These are guidelines, not rules. Run the four-number diagnostic on your own store and let your data override the stage-based defaults if they conflict.
How do I get my team aligned around a single priority when everything feels urgent?
Declare the OMTM explicitly, connect every role’s current work to it, and review the number publicly every week. When someone proposes a project that does not connect to the declared metric, the question is not whether it is a good idea. The question is whether it moves the OMTM. If it does not, it goes on a list for the next 90-day cycle. This is not about being rigid. It is about protecting the sustained attention that breakthrough results require. A weekly 15-minute check-in that opens with the OMTM number and closes with what the team learned that week creates more strategic alignment than quarterly planning sessions. The number becomes the shared language. Progress becomes visible. The team starts to feel what focused momentum actually feels like, which is a competitive advantage that compounds over time.
How do I know when my current bottleneck has been resolved and it is time to focus on something else?
The signal is sufficiency, not perfection. When your current OMTM has reached or exceeded the stage-appropriate benchmark, ask this question: if I improve this metric another 20%, does it unlock more growth than improving a different metric by 20%? When the answer shifts to a different metric, that is your rotation signal. The recommended cadence is quarterly. Ninety days is long enough to see real results from focused effort and short enough to course-correct if you have misidentified the constraint. The mistake to avoid is rotating early because progress has begun. Beginning to improve a metric is not the same as resolving the constraint. Stay on it until the benchmark is met, then run the diagnostic again and let the data tell you where to focus next.
