


Quick Decision Framework
- Who this is for: Beginners entering digital asset markets who are overwhelmed by price chart complexity and want a structured, pattern-based framework for reading market movements without relying on guesswork or emotional decision-making.
- Skip if: You are an experienced technical analyst already trading with a defined signal framework. This guide is specifically for those in the early stages of building their chart-reading foundation.
- Key benefit: Learn the seven most recognizable and actionable chart signals used by professional traders, understand what each one means structurally, and know how to apply volume confirmation to separate genuine breakouts from false ones.
- What you’ll need: Access to a professional charting platform with real-time price data and volume indicators, a basic understanding of candlestick anatomy, and the discipline to wait for signal confirmation before entering a position.
- Time to complete: 12 minutes to read. Immediate application to your chart analysis sessions.
“Price movements that appear chaotic on the surface almost always follow recognizable geometric structures underneath. Learning to see those structures is what separates a trader who reacts from one who anticipates.”
What You’ll Learn
- Why price charts follow geometric patterns that repeat across markets and timeframes, and how recognizing these structures allows traders to move from emotional guessing to evidence-based decision-making.
- How the bullish flag and ascending triangle signal continuation of an existing trend, and what volume behavior during each formation tells you about the strength of the move ahead.
- Why the head and shoulders pattern is one of the most reliable bearish reversal signals in technical analysis, and how to identify the neckline break that confirms the reversal.
- What the double bottom, hammer candle, and engulfing patterns reveal about the balance of power between buyers and sellers at critical price levels.
- How volume spikes function as the verification layer for every other signal on this list, and why a breakout without volume confirmation is one of the most common traps for beginning traders.
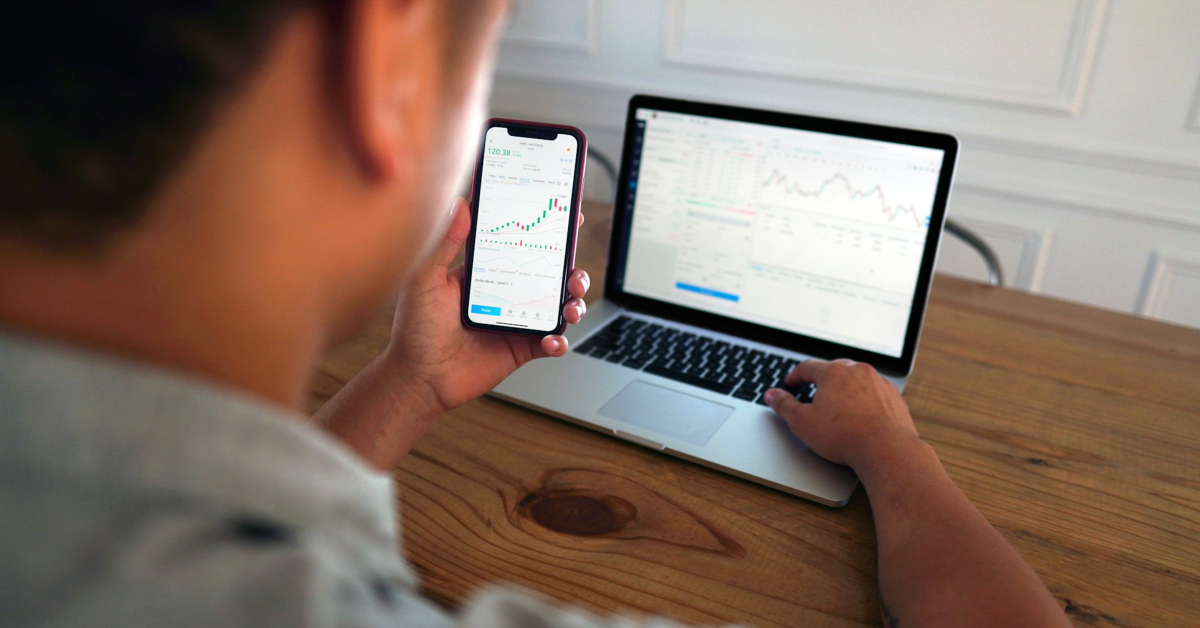
Interpreting price movements is a foundational skill for anyone entering the digital asset markets. While the constant fluctuations on a screen can appear chaotic, they often follow recognizable geometric structures. Learning to identify these patterns allows a trader to transition from making emotional guesses to executing data-driven strategies. Professional charting tools provided by the CoinEx exchange offer integrated features that allow users to overlay indicators and draw trend lines directly on the price interface, ensuring that the signals you identify are based on accurate, real-time market data.
The seven signals covered here represent the patterns that appear most consistently across digital asset markets and that carry the clearest structural logic for a beginning analyst. Each one tells a specific story about the relationship between buyers and sellers at a given price level. Understanding that story is what allows a trader to act on the signal with confidence rather than hesitation.
The Bullish Flag: Momentum Pausing Before It Continues
A bullish flag appears after a sharp upward price movement, known as the flagpole, followed by a small rectangular consolidation period. This consolidation slopes slightly downward or moves sideways, representing a temporary pause as buyers take profits before the next leg of the move. The signal is confirmed when the price breaks above the upper boundary of the flag on high volume, indicating that the original buying pressure has resumed.
Understanding the bullish flag requires recognizing the specific phases of its formation. The flagpole represents a strong, near-vertical surge in buying pressure that establishes the trend direction. The flag body shows a tight consolidation between two parallel trend lines, where neither buyers nor sellers are in full control. The breakout occurs when the price exits the flag in the direction of the pole, which is the moment the signal is confirmed. Volume behavior is the key verification tool throughout this process: it typically declines during the flag formation as the market consolidates, then surges during the breakout as participants commit to the new direction. A breakout on low volume should be treated with skepticism, because it suggests that the move lacks the broad participation needed to sustain it.
The Ascending Triangle: Pressure Building Toward an Upward Break
The ascending triangle is a bullish continuation signal characterized by a flat horizontal resistance line and a rising support line. This structure indicates that sellers are consistently defending a specific price level, but buyers are becoming increasingly aggressive with each successive bounce. As the price bounces between these two converging lines, the range narrows progressively, creating pressure that typically resolves in an upward breakout.
The logic of the ascending triangle is rooted in the changing balance of power between buyers and sellers. Each time the price pulls back from the resistance level, it finds support at a higher point than the previous pullback. This sequence of higher lows tells a clear story: sellers are holding their ground at the top, but buyers are gaining ground at the bottom. Eventually the available space between the two lines becomes so compressed that the price must break in one direction, and the pattern’s structure makes the upward break the statistically more likely outcome. As with all continuation patterns, volume confirmation on the breakout is essential for distinguishing a genuine move from a false breakout that reverses quickly.
Head and Shoulders: The Most Reliable Bearish Reversal Signal
The head and shoulders is one of the most reliable bearish reversal signals in technical analysis, and it is worth studying carefully because it appears consistently at the tops of significant uptrends across all markets and timeframes. The pattern consists of three peaks: a left shoulder formed at the end of a strong bullish move, a higher peak called the head that marks the highest point of the trend, and a right shoulder that forms at a lower level than the head, indicating that buyers no longer have the strength to reach a new high. A neckline is drawn connecting the lows of the two troughs between these three peaks, and a close below this line confirms the reversal.
The structural logic of the head and shoulders pattern reflects the gradual exhaustion of buying pressure. The left shoulder forms as the market makes a new high and then pulls back, which is a normal part of any uptrend. The head forms when buyers make one more attempt to push higher, succeed in reaching a new peak, but then fail to sustain the move. The right shoulder is where the pattern becomes significant: buyers attempt to rally again but cannot reach the level of the head, which tells an analyst that the upward momentum is deteriorating. When the price closes below the neckline, it confirms that sellers have taken control and that the prior trend has reversed. The symmetry of the pattern, specifically the relative heights of the two shoulders and the slope of the neckline, provides additional information about the reliability of the signal.
The Double Bottom: Buyers Defending a Floor
A double bottom is a bullish reversal signal that forms the shape of the letter W on a price chart. It develops after a sustained downtrend when the price reaches a support level, bounces upward, returns to test that same support level, and bounces again without breaking through it. The two equal lows prove that buyers are consistently willing to step in at that price level and are unwilling to let the asset fall further, which signals a potential shift from a downtrend to an uptrend.
The confirmation of a double bottom comes when the price breaks above the peak that formed between the two lows, which is the middle of the W shape. This break confirms that the support level has held on two separate tests and that buyers have gained enough strength to push the price above the prior resistance level. The double bottom is particularly powerful when the second low forms on lower volume than the first, because this indicates that selling pressure is diminishing even as the price revisits the support zone. Traders who wait for the confirmation break rather than anticipating it at the second low avoid the risk of acting on a pattern that has not yet completed.
The Hammer Candle: A Single-Candle Rejection of Lower Prices
The hammer is a single-candle bullish reversal signal that appears at the bottom of a downtrend and communicates a specific and important message about what happened during that trading period. It features a small body positioned at the top of the candle and a long lower wick that is at least twice the length of the body. This distinctive shape indicates that although sellers pushed the price significantly lower during the period, buyers regained control before the period closed and pushed the price back up near the opening level. The long lower wick is a visual record of that rejection.
Several specific characteristics define a valid hammer signal for technical analysis purposes. The small body can be either green or red, though a green body is considered a stronger signal because it indicates that the close was above the open. There should be little to no upper wick present, because a significant upper wick would suggest that buyers also lost control near the top of the candle. The long lower wick must represent a clear and significant rejection of lower price levels, not just a minor intraday fluctuation. Higher volume on the hammer candle increases the reliability of the signal considerably, because it indicates that a large number of participants were involved in the rejection of those lower prices. A hammer on low volume may reflect a lack of sellers rather than an abundance of buyers, which is a meaningfully different market condition.
Engulfing Patterns: Two Candles That Tell a Complete Story
Engulfing patterns consist of two consecutive candles where the body of the second candle completely contains the body of the first. In a bullish engulfing pattern, a small red candle is followed by a large green candle whose body fully engulfs the body of the red candle. This formation signals that buyers have overwhelmed sellers in a single period, absorbing all of the prior selling pressure and adding additional upward momentum. A bearish engulfing pattern is the mirror image: a large red candle completely consumes a small green candle at the top of an uptrend, signaling that sellers have taken control.
The power of engulfing patterns comes from what they communicate about the speed and decisiveness of the shift in market sentiment. A gradual transition from selling to buying pressure is less significant than an abrupt reversal where buyers completely overpower sellers in a single period. The size of the engulfing candle relative to the candle it consumes provides additional information: a very large engulfing candle relative to a small prior candle suggests a more decisive shift than a marginally larger candle engulfing a slightly smaller one. Engulfing patterns are most reliable when they appear at significant support or resistance levels, because the location of the pattern within the broader price structure is as important as the pattern itself.
Volume Spikes: The Verification Layer for Every Other Signal
Volume provides a layer of verification by showing the amount of capital and participation behind a specific price move. A valid breakout from any chart pattern should be accompanied by a significant increase in trading volume, because this spike proves that a large number of market participants agree with the new price direction and are committing capital to it. Without volume confirmation, a breakout may reflect a temporary imbalance rather than a genuine shift in market sentiment.
Understanding how volume interacts with price movement is essential for distinguishing between genuine market signals and temporary noise. Volume confirms trend strength when it rises alongside the price, indicating that the move is being supported by broad participation. Divergence occurs when the price rises but volume falls, which signals that the upward move is losing its foundation and may be approaching exhaustion. Selling climaxes feature extreme volume at the end of a long downtrend, where panic selling creates a final flush that often precedes a reversal. Low-volume breakouts are among the most common traps for beginning traders: the price appears to break out of a pattern, but without the volume to sustain the move, it quickly reverses back into the prior range, leaving traders who acted on the signal with a losing position.
Applying the Signals: Confluence as the Professional Standard
Learning these seven signals provides a framework for interpreting market data, but they should not be used in isolation. Successful traders look for confluence, which is when multiple signals or indicators align to point in the same direction simultaneously. A double bottom pattern becomes significantly more powerful when the second bounce produces a hammer candle on high volume. An ascending triangle breakout becomes more reliable when it is accompanied by a bullish engulfing candle on the breakout bar. The combination of signals reduces the probability of acting on a false positive and increases the probability that the move will sustain itself long enough to be profitable.
Risk management remains the most important part of applying these signals to live trades, regardless of how clearly a pattern appears to be forming. No chart signal carries a guarantee, and even the most reliable patterns fail under certain market conditions. A position sizing approach that limits the capital at risk on any single trade ensures that a failed signal does not produce a loss that is disproportionate to the opportunity it represented. The traders who build consistent results over time are not the ones who identify signals perfectly. They are the ones who manage their risk carefully enough that their winning trades are larger than their losing ones, even when both occur with regularity.
Frequently Asked Questions
What is the most reliable chart signal for beginners to start with?
The head and shoulders pattern and the double bottom are generally considered the most reliable starting points for beginners because they have clear, unambiguous structures and well-defined confirmation points. The head and shoulders pattern confirms with a close below the neckline, and the double bottom confirms with a break above the middle peak. Both patterns provide a specific price level at which the signal is either confirmed or invalidated, which removes much of the subjective interpretation that makes other patterns more difficult for beginners to apply consistently. Professional charting platforms like the CoinEx exchange provide the real-time data and drawing tools needed to identify these patterns accurately across different timeframes.
How do I know if a breakout is genuine or a false signal?
Volume is the primary tool for distinguishing genuine breakouts from false ones. A genuine breakout from a chart pattern, whether it is a bullish flag, ascending triangle, or double bottom, should be accompanied by a significant increase in trading volume that confirms broad market participation in the new direction. A breakout on low or declining volume is a warning sign that the move may lack the support needed to sustain itself. Waiting for a candle close beyond the breakout level rather than acting on an intraday breach also reduces the frequency of false signals, because many apparent breakouts reverse before the period closes. Confluence with other signals, such as a bullish engulfing candle on the breakout bar, provides additional confirmation.
What does volume tell me that price alone cannot?
Volume reveals the level of participation and conviction behind a price move, which price alone cannot communicate. A price increase on high volume tells you that a large number of market participants agree with the direction and are committing capital to it. The same price increase on low volume tells you that the move may reflect a temporary imbalance rather than a genuine shift in sentiment. Understanding market data in this way, as a combination of price and volume rather than price alone, is one of the most important transitions a beginning trader can make. Volume divergence, where price rises but volume falls, is one of the earliest warning signs that a trend is losing its foundation, often before the price itself shows any sign of reversal.
Can these chart signals be applied to assets other than cryptocurrency?
Yes. The seven signals covered here are drawn from classical technical analysis and apply across all liquid markets including equities, foreign exchange, commodities, and digital assets. The geometric patterns that form on price charts reflect universal human behavior around buying and selling decisions, which means they appear consistently across markets and timeframes. The primary requirement for these patterns to function reliably is sufficient liquidity, because thinly traded assets can produce chart formations that appear structurally valid but are distorted by the lack of genuine market participation. In highly liquid markets, the signals described here have been observed and documented consistently for decades across every major asset class.
What is confluence and why do professional traders prioritize it?
Confluence refers to the alignment of multiple independent signals or indicators that all point in the same direction simultaneously. Professional traders prioritize confluence because any single chart signal carries a meaningful probability of failure, but the probability of multiple independent signals all failing in the same direction simultaneously is significantly lower. A double bottom pattern that forms alongside a hammer candle on the second bounce, confirmed by a volume spike, represents three separate pieces of evidence pointing toward the same conclusion. Each additional confirming signal reduces the likelihood that the pattern is a false positive and increases the probability that the subsequent move will be sustained. Building a trading practice around confluence rather than single-signal entries is one of the most effective ways to improve the reliability of technical analysis decisions over time.
