


Verified & Reviewed
Published on October 30, 2025 Written By Warren Brown

Published on October 30, 2025 Written By Warren Brown

Subscribe for More
In the fast-moving ecommerce and CPG industry, tying up cash in the wrong inventory is more than an operational headache; it’s a growth killer.
Brands that master inventory usage data stay in stock, cut waste, and fuel expansion. Understanding how your products move, where cash is tied up, and how to optimize replenishment is no longer optional, but rather essential for scaling confidently.
For ecommerce and CPG businesses shipping tens of thousands of units each month, inventory is a lever that controls cash flow, operational efficiency, and the ability to grow without friction. With the right tracking strategy, you can reduce stockouts and free up working capital, as well as make smarter expansion decisions.
In this post, we’ll cover what inventory usage is, how to calculate it and track it, and best practices to minimize errors and automate the process.
What is inventory usage?
Inventory usage measures how much stock an ecommerce or CPG brand consumes over a given period.
Inventory usage is a critical metric that provides insight into cash flow, operational efficiency, customer satisfaction, and forecasting accuracy.
When tracked correctly, inventory usage becomes a lens for understanding how effectively your stock is moving through your business and where opportunities exist to optimize working capital.
How do you measure inventory usage?
Inventory usage (also called inventory velocity, inventory turns, days inventory outstanding, days of supply, or weeks of supply) can be calculated in two ways: by units and by dollars. Each calculation has its own valuable purpose.
- By Units: Inventory Usage = Total units of inventory on hand / average daily or weekly sales of the same SKU in units.
- Example: If you have 1,000 units on hand, sell 5 units per day over the next three months, your inventory usage would be calculated like so:
- 1,000 / 5 = 200 days
- By Dollars: Inventory Usage = Total dollar value of inventory on hand / average daily or weekly COGS of the same SKU in dollars.
- Example: Say you have 1,000 units of inventory, and each unit has a landed cost of $5.50. You sell each 5 units a day. In this case, your inventory usage in dollars would be:
- (1,000 units x $5.50) / (5 units per day x $5.50 per unit) = 200 days
The two calculation methods will yield the same result for an individual SKU, but can yield useful differences across a collection of SKUs with different sales velocities and margins. Inventory Usage (dollars) is most often used when analyzing financial statements when unit balances aren’t available.
How important is it to have accurate inventory data when calculating inventory usage?
Accurate inventory usage data empowers brands to:
- Avoid stockouts: By understanding daily or weekly consumption patterns, you can ensure your best-selling products are consistently available. Preventing stockouts strengthens customer trust, improves retention, and maintains marketplace performance metrics.
- Reduce overstock costs: Slow-moving inventory ties up cash and increases storage costs. Tracking usage helps businesses keep stock levels lean without risking availability. This frees capital for strategic initiatives like marketing campaigns, product launches, or expanding to new sales channels.
- Plan smarter: Usage data informs purchasing decisions and demand forecasting. Brands can adjust orders based on seasonal trends, promotional spikes, or regional variations, reducing guesswork and the risk of misaligned inventory.
Why should I track inventory usage?
Beyond cash flow implications, tracking inventory usage affects operational efficiency. For example, knowing your inventory usage can help your brand:
- Reduce emergency orders and rush shipping costs.
- Improve warehouse labor planning by predicting pick volumes.
- Determine optimal, automated reorder points so replenishment happens seamlessly.
- Support accurate reporting for investors, CFOs, or board members who want visibility into capital tied in inventory.
By connecting usage metrics to both financial outcomes and operational planning, businesses gain a comprehensive view of their inventory health, helping them make smarter, faster decisions that drive growth.

Business impacts every ecommerce and CPG operator should know
Inventory usage is more than another metric on a spreadsheet. Rather, it directly influences an ecommerce or CPG brand’s profitability, operational efficiency, and customer experience. When usage is tracked accurately, businesses can make smarter decisions that prevent costly mistakes and unlock growth opportunities.
Specifically, staying attuned to your brand’s inventory usage lets you:
- Reduce stockouts and overstock: Accurate usage data helps ecommerce and CPG brands maintain the right balance of inventory. Avoiding stockouts ensures popular products are always available, protecting sales and customer trust. On the flip side, monitoring usage prevents excess inventory from sitting idle in warehouses, reducing storage costs and freeing up working capital for marketing, product launches, or expansion.
- Maintain retention and marketplace SLAs: For ecommerce and CPG brands selling on multiple channels, consistent inventory levels are essential to meet marketplace service-level agreements (SLAs) and keep customers satisfied. Running out of stock can harm seller ratings on platforms like Amazon or Walmart, while consistent fulfillment strengthens brand reputation and encourages repeat purchases.
- Minimize B2B penalties: Wholesale partners often impose penalties for missed or late shipments. By using inventory usage data to forecast and allocate stock correctly, businesses can maintain high fill rates, avoid fines, and preserve strong relationships with retail and distribution partners.
Category Nuances
Different product categories require tailored usage tracking strategies.
- Beauty & Skincare: Seasonal launches, limited-edition products, and expiration dates make accurate tracking essential. Overordering can lead to waste, while underordering could mean missed revenue during peak periods.
- Food & Beverage: Perishable items demand strict FIFO (first-in, first-out) or FEFO (first-expiring, first-out) inventory methods. Even minor miscalculations can result in spoilage, write-offs, and lost consumer trust.
- Apparel: Multiple SKUs by size, color, or style mean that small discrepancies in inventory usage can lead to markdowns or lost sales. Understanding which variations move fastest is key to keeping shelves (and ecommerce listings) stocked with the right products.
By tracking inventory usage at the category and SKU level, brands can optimize stock allocation across fulfillment centers, reduce waste, and ensure that high-demand products are always available. This not only improves profitability, but also strengthens operational resilience, customer satisfaction, and long-term business growth.
Signs your inventory usage tracking needs improvement
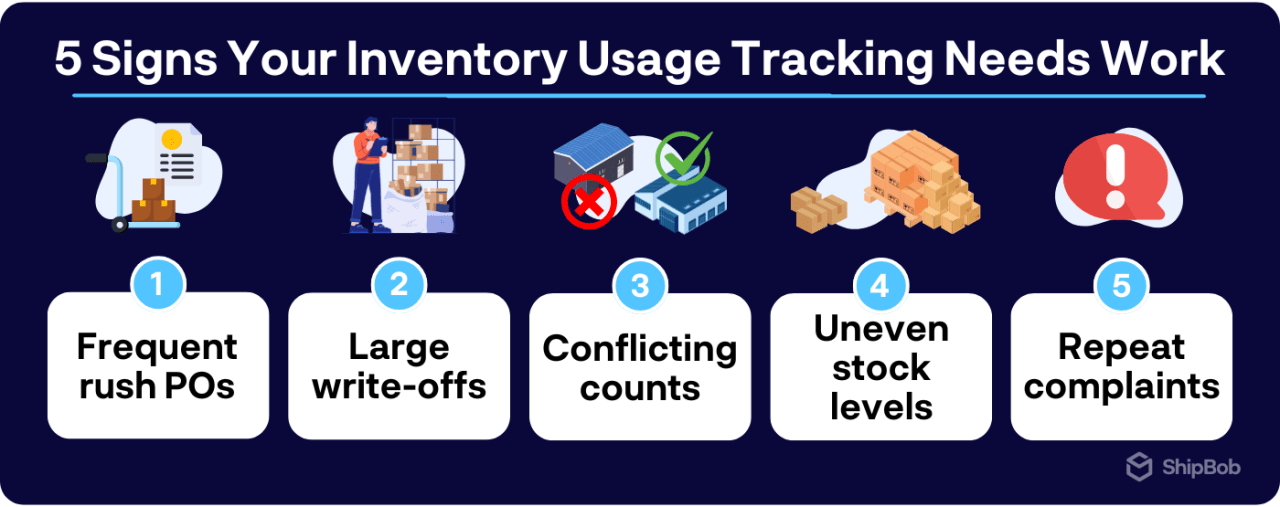
Even the most experienced operators can lose control of their inventory without accurate inventory usage data. If your ecommerce or CPG brand is flying blind, the warning signs usually appear in your daily operations and finances.
- Frequent emergency purchase orders or rush freight: If your team is constantly placing last-minute orders to cover stockouts, that’s a clear indicator that inventory usage isn’t being tracked effectively. Emergency shipments not only increase costs, but also create operational stress for warehouse teams and fulfillment partners.
- Large write-offs for expired, damaged, or obsolete goods: Overestimating demand or mismanaging stock rotation can lead to inventory that expires, spoils, or becomes unsellable. These write-offs tie up capital and reduce overall profitability, often masking inefficiencies that could be solved with proper usage tracking.
- Conflicting counts between warehouse inventory and spreadsheets or ERP reports: When physical stock and your spreadsheets or ERP system don’t align, it signals gaps in your tracking process. These discrepancies can lead to misinformed purchase decisions, missed sales, and inaccurate financial reporting.
- Stock discrepancies across multiple fulfillment centers: For businesses operating across several warehouses or regions, uneven stock levels often reflect a lack of visibility into SKU-level consumption. Some fulfillment centers may run out of a SKU while other warehouses sit on surplus, creating unnecessary shipping costs and lost sales.
- Repeated customer complaints about out-of-stock items: When customers encounter unavailable products, it not only harms trust but also impacts retention and brand reputation. If stockouts are recurring, it’s often a symptom of poor inventory usage tracking rather than demand volatility alone.
Addressing these red flags early prevents lost revenue, operational inefficiencies, and strained supplier relationships. Brands that detect and correct gaps in inventory tracking can reduce costs and improve fulfillment reliability to ultimately create a stronger foundation for growth.
Formulas to calculate inventory usage with confidence
Understanding how much stock moves, when it moves, and where it moves allows ecommerce and CPG brands to make smarter purchasing, fulfillment, and cash flow decisions.
Start by using the following formulas to calculate and track these key metrics at the SKU level. Once you’re comfortable with the calculations, you can perform them weekly, monthly, or for seasonal periods for a more complete view of inventory performance.
Core Formulas
1. Daily Usage
Daily Usage = Units Sold ÷ Days in Period
Daily usage shows how many units of a product are sold on average per day. Tracking this over time helps businesses anticipate demand, plan replenishment, and identify unusual spikes or drops in sales.
2. Days on Hand
Days on Hand = Current Units ÷ Daily Usage
Days on hand indicates how long existing stock will last based on current consumption patterns. This metric is critical for avoiding stockouts or overstocking, especially during seasonal peaks or promotional campaigns.
3. Reorder Point
Reorder Point = (Daily Usage × Lead Time) + Safety Stock
The reorder point tells you the inventory level at which a new order should be placed to avoid running out. Incorporating lead time (how long it takes suppliers to deliver) and safety stock (buffer for unexpected demand) ensures reliable fulfillment.
Pro Tips for Accurate Calculations
- Adapt formulas to fulfillment models: DTC single-pick orders move differently than wholesale case packs. Understanding these nuances ensures you calculate usage accurately for each channel.
- Track inventory usage at the fulfillment center level: Multi-location brands should monitor consumption per warehouse to spot regional demand shifts and optimize inventory placement.
- Monitor SKU-level trends and seasonal variations: Usage isn’t static. Track top movers, slow movers, and seasonal spikes to prevent surprises that could tie up capital or cause stockouts.
- Integrate with reporting systems: Linking metric tracking to your inventory management software reduces manual errors and provides perpetual, real-time insights for faster decision-making.
3 ways to track inventory usage
How brands track inventory usage varies, with some using simple manual methods while others fully automate reporting. The right approach depends on your brand’s size, SKU complexity, and fulfillment model.
1. Pen-and-Paper or Basic Spreadsheets
The manual, “old school” approach to tracking inventory usage has its benefits – it’s low cost, quick to start, and suitable for small operations or early-stage businesses with limited SKUs.
However, manual calculations are prone to errors, and doing everything by hand makes it hard (or even impossible) to achieve real-time visibility into inventory levels. As order volume and SKUs increase, spreadsheets can also become difficult to maintain and error-prone.
Tips for Success:
- Lock cells for formulas.
- Use data validation to prevent mistakes.
- Set conditional formatting to flag low stock automatically. Google Sheets or Excel can also be linked to ecommerce platform exports for semi-automated tracking.

2. Inventory Management Software (IMS) or ERPs
Running an ecommerce or CPG brand is fast-paced and competitive, and the right inventory management software will do more than track stock. The best IMS will calculates margins, improve fulfillment, and provide insights to grow without guesswork.
With real-time tracking, automated purchase orders, COGS calculations, and demand forecasting, a good IMS helps prevent overstocking and stockouts while keeping inventory aligned across channels. Think of it as an operations co-pilot keeping SKUs flowing, products available, and margins accurate so you can make smarter, faster decisions.
Key Features to Look For:
- Real-Time Inventory Tracking: Track stock across warehouses, online stores, and marketplaces in real time to prevent overselling and ensure accuracy.
- Streamlined POs and Receiving: Automate purchase orders, track multiple shipments, hold vendors accountable, and free your team to focus on growth.
- Automated Three-Way-Match: Match POs, invoices, and shipping receipts instantly, quickly spot discrepancies, and save time on vendor credits.
- Multi-Channel Integration: Sync inventory across Shopify, Walmart, TikTok, Amazon, and more to maintain consistent stock and avoid missed sales.
- Demand Forecasting & Analytics: Use historical sales, trends, and market insights to predict demand and optimize stock.
- Embedded Payments: Gain real-time visibility into gross margin, COGS, and inventory valuation while simplifying month-end close and bookkeeping.
- Reporting & Insights: Access actionable data on sales, inventory usage, and product performance to make smarter decisions and improve inventory management.
- Free Starter Plans: Leading inventory management systems offer free starter plans for emerging ecommerce sellers to make it fast, easy and inexpensive to get them up and running.
If you need help choosing an inventory management software provider, check out this 2025 guide on the 12 best inventory management software providers for ecommerce brands.
3. Third-Party Logistic (3PL) Analytics for Real-Time Clarity
Working with the right 3PL partner can give ecommerce brands access to powerful inventory analytics across multiple fulfillment centers. The right 3PL analytics platform provides real-time insights that help track stock movements, monitor trends, and make data-driven decisions without being tied to a single provider.
Must-Haves in a 3PL Partner:
- Inventory snapshot reports that monitor daily SKU movements across all fulfillment centers to spot discrepancies, identify stock imbalances, and ensure accurate counts.
- Inventory velocity reports that measure average daily usage and days on hand to optimize reorder points, prevent stockouts, and improve cash flow management.
- ERP integrations that push 3PL inventory usage data into platforms like NetSuite, QuickBooks, or other ERPs to create a single source of truth for inventory, sales, and forecasting.
- Multi-fulfillment center visibility to track inventory per location to respond quickly to regional demand shifts, minimize shipping costs, and maintain service levels across DTC, B2B, and marketplace channels.
- Reporting & insights that let you access actionable metrics on stock usage, SKU performance, and fulfillment trends to reduce waste, prevent shrinkage, and make smarter growth decisions.
By leveraging 3PL analytics, businesses gain real-time control over inventory across all locations, ensuring products are available when customers need them, while freeing teams from manual reporting and helping scale operations confidently.

Best practices to reduce inaccuracies, shrinkage, and waste
Even small inventory inefficiencies add up; 1–2% inventory shrinkage can significantly impact margins, especially for fast-moving ecommerce and CPG brands.
To stay on top, brands should implement consistent processes and leverage data to catch issues early. Some best practices to follow include:
- Standardize counting and reconciliation cycles: Establish regular schedules for inventory counts and reconciliations to maintain accurate records across all warehouses and channels.
- Weekly spot checks and monthly cycle counts: Focus weekly spot checks on top-selling SKUs and conduct full monthly cycle counts, syncing results with snapshot or usage reports to ensure accuracy.
- Track at the SKU–fulfillment center level: Monitoring inventory per location allows businesses to identify regional demand shifts, prevent stock imbalances, and make smarter allocation decisions.
- Apply FIFO/FEFO rules for perishable or seasonal goods: Rotate stock correctly, flag items approaching expiration, and ensure seasonal products are sold before they lose value.
- Schedule auto-replenishment: Set reorder points and lead times to automatically trigger replenishment before critical stock levels, avoiding last-minute rush orders.
- Compare expected vs. actual picks: Regularly review discrepancies to detect theft, mispicks, or listing errors and take corrective action quickly.
Pro Tip: Leveraging accurate landed costs, real-time inventory usage and inventory usage and automated COGS calculations from inventory management platforms like Settle helps brands spot unusual consumption patterns, highlight potential losses, and act proactively to reduce waste. When combined with structured counting processes, this approach safeguards margins, ensures products are available when customers need them, and supports growth without unnecessary stock buildup.
Turn inventory usage insights into growth moves
Accurate inventory usage powers strategic growth. Daily, weekly, and seasonal stock insights enable ecommerce and CPG brands to:
- Forecast & budget better: Rolling 30-day usage improves demand projections, reduces overstock, and protects cash flow.
- Free up working capital: Track exactly what inventory is needed and reinvest excess cash into marketing, launches, or expansion.
- Optimize placement globally: Allocate stock across warehouses efficiently, lowering transit times and shipping costs.
- Plan promotions & channels confidently: Usage history highlights peak periods, reducing stockout risk.
- Mitigate risk across channels: Ensure inventory aligns with SLAs, marketplaces, and B2B agreements.
Recommended setup: ShipBob & Settle
Settle provides an all-in-one platform for ecommerce and CPG brands, combining real-time inventory tracking, purchase order management, analytics dashboards, embedded payments, and automated demand forecasting. By unifying operational and financial workflows, Settle helps ecommerce brands save 10-20 hours a month and as much as $200,000/year by reducing manual work, improving margin visibility, and allowing teams to focus on scaling instead of spreadsheets. Businesses can also tap into purchase order financing, freeing working capital for growth opportunities without stretching the balance sheet.
ShipBob complements this by offering AI-driven fulfillment, multi-warehouse visibility, and seamless integration with major ecommerce platforms like Shopify, Amazon, and Walmart. Its cloud-based WMS delivers real-time inventory tracking, efficient pick-and-pack workflows, and cost-effective 2-day shipping. With ShipBob, brands gain operational clarity, faster delivery, and scalable logistics, whether using ShipBob alone or in a hybrid fulfillment strategy that taps into their global fulfillment network.
How ShipBob automates inventory usage tracking and solves common challenges
In today’s fast-moving ecommerce environment, your fulfillment partner needs to be more than just a warehouse – it must act as a platform partner, bringing together your inventory, order, and fulfillment operations under one roof.
That’s where ShipBob comes in. With built-in analytics and a unified fulfillment ecosystem, ShipBob empowers brands to convert inventory usage data into both profitability and outstanding customer satisfaction.
Here are just some of the ways ShipBob helps ecommerce and CPG brands track inventory usage and leverage that data to maximize success.
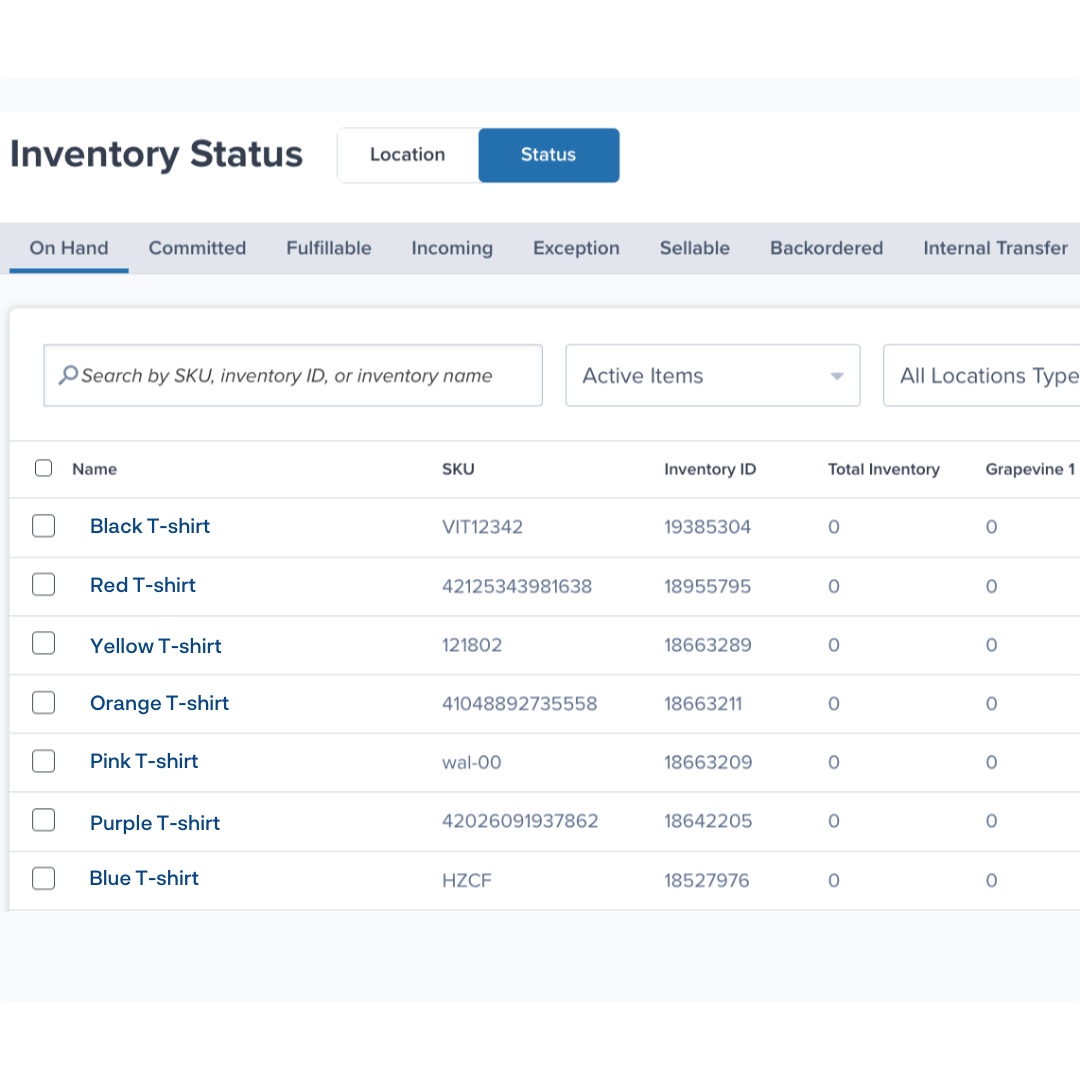
Real-time visibility into usage + dozens of other analytics
Many merchants struggle because they don’t have actionable, day-to-day insight into how much inventory is being used, where it is, and how fast it’s moving. ShipBob’s dashboard delivers real-time inventory tracking across all locations and SKUs, so you can see on-hand quantities, recent activity, and remaining days of stock – all updated automatically via barcode scanning and integrated, cloud-based IMS capabilities.
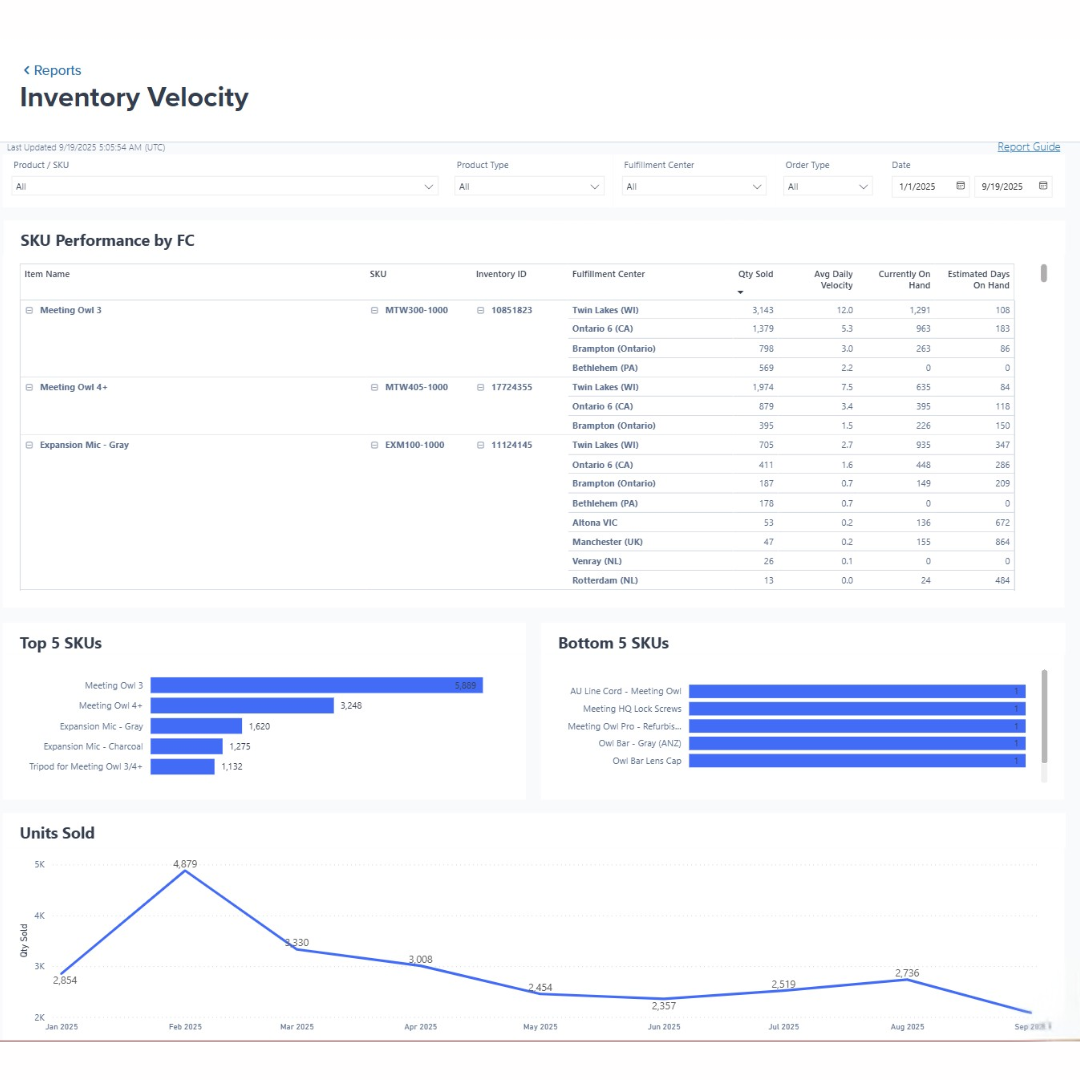
Automated inventory tracking that scales with you
When you rely on spreadsheets for inventory usage, you quickly hit limitations: errors creep in, calculations lag, and you lose the agility needed at scale. ShipBob’s inventory analytics allow you to visualize SKU velocity (how fast units sell or move) and days on hand, built right into the dashboard so you don’t have to build manual formulae or chase down data across systems.
Integrate your ERP and fulfillment data
Without integration between your enterprise resource planning (ERP) system and your fulfilment partner, usage data lives in silos – in other words, orders, stock movements, returns may not talk to each other.
With ShipBob’s API and developer tools, you can sync inventory levels, usage events, and fulfilment data back into systems such as NetSuite (and others), ensuring your core systems reflect accurate, real-time usage from the warehouse.
“The beautiful thing about it is everything was connected. I could log on to our ShipBob account and see everything in one place, no matter if I’m looking at our facility in Kankakee, IL, or the ShipBob fulfillment centers in Canada or Europe. It was all the same system. I didn’t have to learn various different platforms or deal with support representatives at different companies.
Plus, if we experience any issues with syncing orders between systems, there’s one place we go to reconcile it. ShipBob is connected to our ERP, NetSuite, which is our single source of truth. Now we only have one place to troubleshoot and resolve potential issues across all logistics.”
Adam LaGesse, Global Warehousing Director at Spikeball
Catch discrepancies quick to minimize shrinkage and waste
Shrinkage, damage, and mis-counts often go undetected until they impact margins. ShipBob’s inventory and reporting capabilities enable you to export snapshot data and filter by transaction types (receiving, adjustments, transfers, picks) so discrepancies become visible quickly. ShipBob can also help you perform an inventory audit to make sure your recorded inventory matches your physical counts.
“Before partnering with ShipBob for order fulfillment, we had a lot of trouble getting visibility into inventory movement. We worked with some large fulfillment providers as well as some smaller 3PLs, and none of them gave us unified data, let us look at inventory holistically, or enabled us to see which inventory was moving and where. The reporting formats for every fulfillment provider were different yet incomplete, and taking all of that data and piecing it together to figure out what was going on was a nightmare. I got to a point where I just couldn’t operate like that any more.
Partnering with ShipBob, we joined their Inventory Placement Program, which helps us distribute our inventory to strategic hubs across the US so we don’t have to manage multi-location inbound shipments or identify the most optimal fulfillment center locations ourselves. This finally gave us the visibility and analytics we were looking for. Through the program, we get real-time insight into how much inventory to allocate to a specific warehouse, our current on-hand inventory levels, and how long each SKU is going to last by location. ShipBob provides a lot of distribution metrics, and everything presented is useful.”
Mithu Kina, Founder and CEO of Baby Doppler
For more information on how ShipBob can help your brand track and leverage inventory usage data, click the button below to get in touch.
Inventory Usage FAQs
Here are answers to some of the most common questions about inventory usage.
How often should I calculate and review inventory usage?

- High-volume SKUs: Daily reviews ensure stock aligns with fast-moving demand.
- Moderate-volume SKUs: Weekly tracking helps spot trends and adjust orders.
- Slow-moving SKUs: Monthly audits prevent overstock while monitoring expiration or obsolescence.
What is a good inventory usage rate?
There is no universal benchmark for “good” inventory usage. Rather, inventory usage rates depend on product type and category.
Fast-moving consumer goods (FMCG) typically turn over quickly, whereas premium or seasonal items move slower. The goal is to balance usage with availability to maximize revenue without tying up excess cash.
How does Settle help optimize inventory usage?
Settle connects inventory usage data across multiple warehouses and fulfillment centers, integrates seamlessly with ERPs, and generates automated reports. Its dashboards provide actionable insights into SKU-level trends, helping businesses reduce shrinkage, optimize stock placement, and plan growth. By combining inventory management, demand forecasting, and embedded payments, Settle empowers ecommerce and CPG brands to make data-driven decisions without manual tracking or spreadsheet errors.
Can I track inventory usage in multiple fulfillment centers?
Yes. With ShipBob, you can view inventory usage across all fulfillment centers from one centralized dashboard. This unified visibility lets you monitor SKU movement in real time, compare velocity between locations, and balance stock levels globally to prevent over- or under-stocking in specific regions.
What ERP systems integrate with ShipBob for usage tracking?
ShipBob integrates seamlessly with leading ERP and inventory platforms such as NetSuite, Cin7, and Brightpearl, and more. These integrations sync inventory and order data bi-directionally, ensuring consistent, real-time usage information across your fulfillment, accounting, and supply chain systems. That means your team can make confident purchasing and forecasting decisions using one trusted source of truth.
What causes mismatched usage reports vs. physical counts?
Discrepancies between system reports and on-hand counts can happen for a few reasons, most commonly:
- Human error during manual adjustments
- Timing differences in data updates
- Shrinkage from lost or damaged items
Does ShipBob help reduce shrinkage and waste?
Absolutely. ShipBob’s daily inventory tracking and movement logs help brands detect anomalies early and investigate root causes quickly. Because every action from receiving to picking is tracked in real time, you can pinpoint when and where discrepancies occur. As a result, most brands using ShipBob maintain shrinkage rates below 1%, protecting both profitability and product integrity.
