


Introducing the Yotpo DTC Index
Today, we’re excited to unveil the Yotpo DTC Index – a first-of-its-kind online tool, built entirely with, and only possible thanks to, AI native tools. This free and interactive tool is designed to help brands track performance benchmarks and insights from the world’s top public DTC brands.
Backed by Yotpo’s 12+ years of experience, powering tens of thousands of ecommerce brands, from fast growing entrepreneurs to household brand names, this index offers unique visibility to trends and actionable strategies and learnings, for anyone invested in DTC – from operators and marketers to founders and leading consultants.
Key Takeaways
- A first-of-its-kind AI-built tool: The Yotpo DTC Index is an online, AI-powered benchmark and insight platform built entirely using AI-native tools and no-code systems.
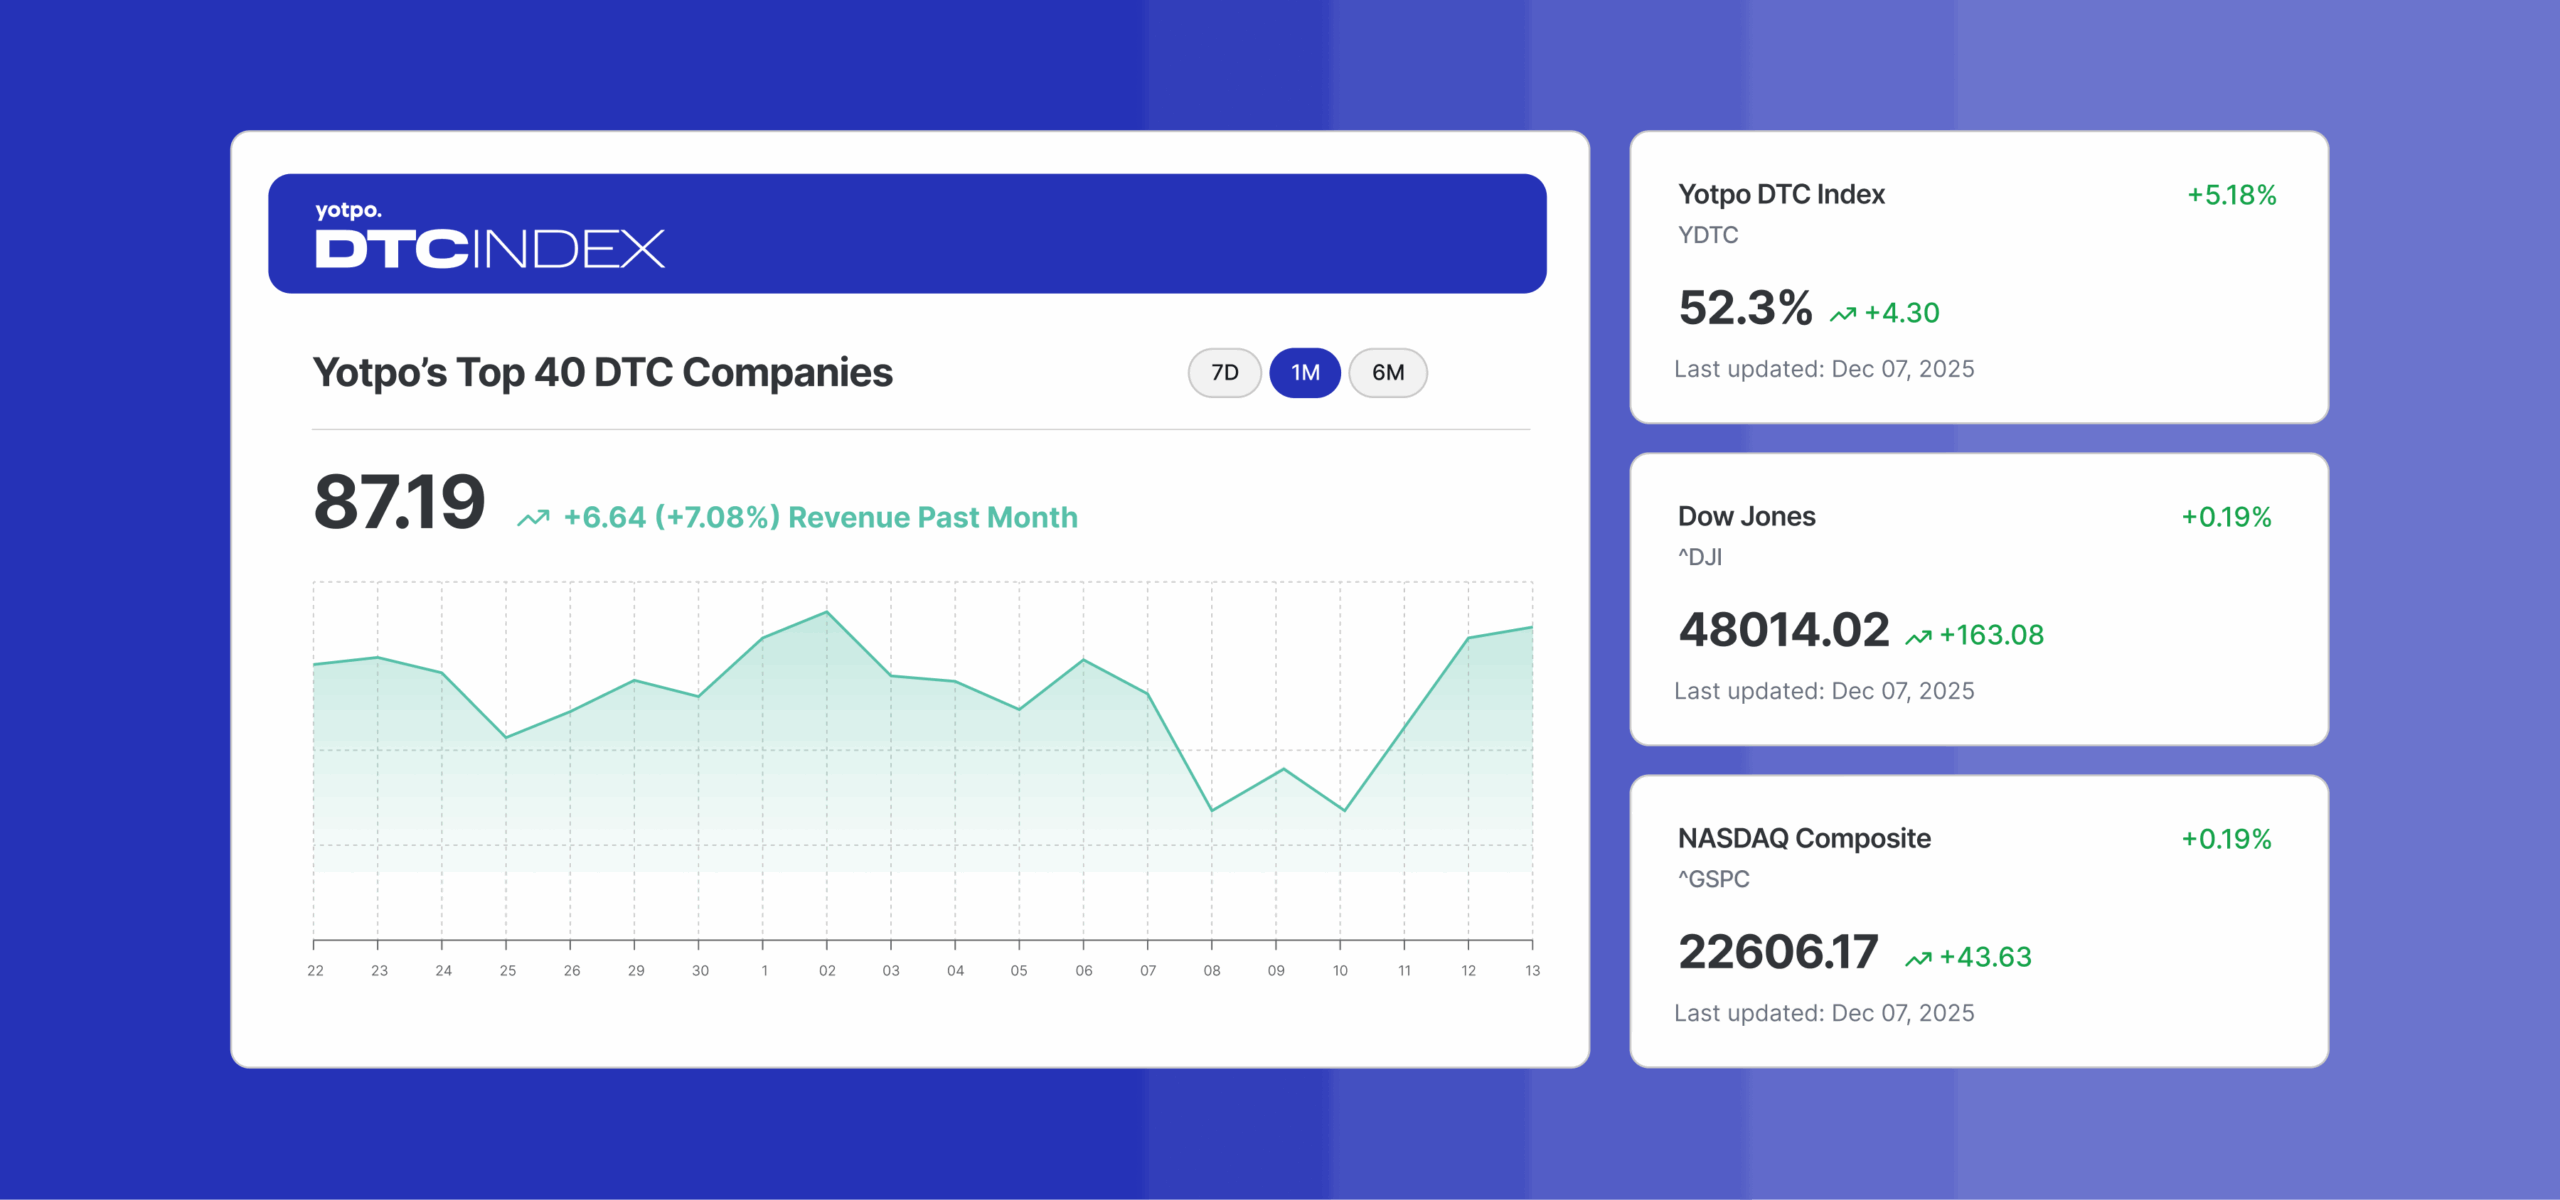
- Track ~40 influential public DTC-oriented companies: The Index is composed of public companies with significant DTC revenue, including both digital-native brands and large retailers with major direct channels.
- Combining quantitative and qualitative insights: The Index tracks financial performance (e.g., stock prices, market caps, revenue growth rates) and uses AI to extract themes and sentiment from earnings call transcripts and analyst commentary.
- See DTC performance in market context: The Index can be compared to major benchmarks such as the S&P 500, Nasdaq, and retail-focused ETFs for additional context.
- Built to scale insight discovery: AI summarizes earnings reports and commentary each quarter to highlight common themes, trends, and sentiment across the DTC sector.
- Free and evolving: The tool is free to use, updated quarterly, and includes a feedback form to guide future improvements and additional features.
Why We Built The Yotpo DTC Index (and How We Did It)
The idea for the Yotpo DTC Index was born out of our own passion for understanding eCommerce macro trends. eCommerce brands have been riding a rollercoaster for the past few years – and it’s not showing signs of slowing down. After the pandemic-era boom came iOS privacy changes, rising digital ad costs, inflation squeezing consumer spending, supply chain snarls, and now tariff uncertainties.
The DTC model, once the darling of VCs, has hit growing pains as acquisition gets pricier and investors demand profits, not just growth. Many digital-first brands have been struggling through continued headwinds, yet at the same time, some companies are still managing to thrive despite it all.
It raises the billion-dollar question: what are the best-in-class DTC players doing right, and what does “good” performance look like in this climate? That’s exactly what we ultimately set out to help answer with the Yotpo DTC Index. Insight at scale: By tracking the collective performance of the top DTC brands, our index aims to help eCommerce teams benchmark themselves against the industry and learn from the leaders. But we didn’t stop at pulling stock charts or revenue growth stats – we wanted to know why certain brands are outperforming.

As Yotpo’s Head of Strategy, one thing I’ve done for years is deep-dive into earnings reports and industry chatter – I would listen to public company earnings calls, pore over transcripts, and then join calls with some of our largest brand customers and partners to discuss the state of the industry and the most recent “hacks” or trends.
These kinds of activities were always illuminating, but extremely timely, and I often found myself thinking: “I wish there were a better way to scale this kind of research and share the insights with all our customers and ecosystem.” Then came ChatGPT Deep Research, and a host of mind blowing new tools & capabilities followed. It felt like the perfect opportunity to make that wish a reality.
We also wanted to find out – could we build a sophisticated market analysis tool – essentially an index + insight platform – using AI as our co-pilot, all without a single engineer? We relied almost entirely on AI-native tools like ChatGPT, Gemini, Lovable, Claude, and no-code automation platforms like n8n, with a Supabase database and Synthesia for our video explainer. With the help of some of Yotpo’s incredibly talented team members who wished to join this AI side project, we rapidly brought the idea to life.
The tool you see today is only the beginning – we included a form to collect feedback if there’s a metric you’d love to see, a feature that would make the tool more useful, or any insights you’ve noticed and we missed, please let us know – we’re building this for the community, and we’ll continue to refine it with your input.
How it works under the hood
We tapped into financial data APIs using FMP to pull key performance data for each company – stock prices, market caps, revenue growth rates, and other financial metrics – and used those to calculate the index as if it were a stock index (though note, the Yotpo DTC Index itself isn’t an investable security, just a benchmark we compute for insights).
We also leveraged AI for something truly game-changing: extracting insights from earnings call transcripts and analyst commentary. In the past, gathering qualitative insights (like what CEOs are saying about consumer demand or which strategies analysts praise) across dozens of companies would be a herculean task. Now, we can have AI sift through and summarize the common themes each quarter, summarize them and give them sentiment scores for comparison and aggregation. The result is an index that doesn’t just track stock performance or revenue numbers, but also surfaces the why behind the numbers – the strategic moves, market forces, and consumer trends driving DTC brands up or down. We believe this combination of hard data and AI-driven commentary makes the Yotpo DTC Index uniquely valuable.
Every quarter, we’ll be issuing AI-generated summaries and reports of the main trends we’re seeing (more on the latest findings below), and we’ll send them to everyone who subscribes to the tool – entirely for free. Our goal is to democratize access to these insights and spark a more informed, mutually beneficial conversation across the DTC ecosystem.
Inside the DTC Index: Who’s Included and What It Measures
Let’s talk specifics. The Yotpo DTC Index (“YDTC” for short) is composed of ~40 companies that we consider the most influential and representative of direct-to-consumer commerce today. To be included, a company must be publicly traded (so that there’s transparent data) and must have a significant portion of revenue coming from direct channels (owned eCommerce, owned retail stores, or subscription models – as opposed to purely wholesale or marketplace sales), relative to companies in its industry.
This gave us a mix of:
- Digital-Native Brands – Many of which went public in the last 5-6 years. Think of eyewear pioneer Warby Parker, sustainable shoemaker Allbirds, telehealth and wellness brand Hims & Hers, personal care disruptors like Oddity Tech (owner of Il Makiage and SpoiledChild), and others. These are brands that started DTC from day one, built their names through social media and online channels, and later IPO’d. They often still get lumped together as “DTC darlings,” though their fortunes have diverged widely (more on that below).
- Established Retail Brands with Major DTC Segments – This includes global apparel and footwear leaders such as Nike and Adidas, which, while not “DTC-only” companies, have transformed their business models in recent years to prioritize direct sales. (Nike’s digital and direct channels now make up roughly half of its revenue, and Adidas similarly generates around 40% from DTC, up from just 20-30% a decade ago – a seismic shift in go-to-market strategy.) We’ve also included Lululemon, a brand that, despite a robust store base, has a huge eCommerce operation and a strong community-driven DTC ethos, and Aritzia, the fashion retailer that has blended boutiques with a booming online business. These companies underscore that DTC is not just a niche for venture-backed startups – it’s now a core strategy for established Fortune 500 brands.
- Consumer Product Leaders Embracing DTC – For example, e.l.f. Beauty, the cosmetics brand known for affordable products, sells through retailers but has also built a cult DTC following via its own site and loyalty program – and has been one of the fastest-growing beauty companies in recent years. We also track certain categories like CPG and health where DTC is rising (for instance, Oddity Tech, which is explicitly a DTC beauty player with AI at its core).
- Contextual Benchmarks – We included a handful of big retailers who are not considered DTC in parts of the tool (but obviously not into the index itself), to provide reference points for certain views. For instance, when comparing stock performance, it’s insightful to see our DTC Index graphed against the S&P 500 or against a retail-heavy index. In some of our charts within the tool, you can compare YDTC versus indices like the S&P 500, NASDAQ, or S&P Retail ETF – to gauge whether DTC-oriented companies are faring better or worse than the market at large. (Spoiler: at times this year they outperformed, but not consistently.)

The index itself is market-cap weighted, meaning larger companies have a bigger influence on the index’s movement. This approach mirrors major indices like the S&P 500. It also means that the likes of Nike or Lululemon (market caps in the tens of billions) will sway the index more than a small-cap like Allbirds. We chose this weighting to reflect real-world impact – bigger companies matter more to the overall DTC ecosystem by revenue – but in our analysis we also look at median figures and outliers to make sure we’re highlighting the smaller high-growth gems as well. The YDTC index value itself is calculated as if all these companies were components of a single stock index (with a base value set at a certain date in the past).
While you can’t invest directly in YDTC (yet ;)), you can use it to compare against other indices to see how DTC-centric brands as a group are trending. Every quarter, after the dust settles on earnings season, we’ll publish a summary of what we learned. These will cover both the quantitative side and the qualitative insights (e.g. “Most DTC CEOs mentioned improving supply chain costs” or “Many brands cited strength in loyalty program engagement”). We’ll deliver these insights straight to your inbox if you subscribe on the DTC Index page. And of course, the tool itself is live for you to explore at any time: you can dive into the interactive charts and data on the Yotpo DTC Index page.
Key Insights from the Yotpo DTC Index: Q1 – Q3 2025
Looking at the YDTC Index’s performance and the underlying company results through the first nine months of 2025, a few themes jump out:
- A Strong Start, Then a Tariff Shock: The year began on a hopeful note for DTC brands. Through Q1 2025, our index of DTC-heavy companies was actually outperforming broader market benchmarks like the S&P 500 in terms of stock performance and growth. It seemed eCommerce was rebounding nicely after a shaky 2024. However, spring brought new headwinds – notably rumors of sweeping tariffs that rattled the retail sector. On April 2, 2025 (what some in the industry wryly dubbed “Liberation Day”), news of impending tariffs sparked a sharp market selloff, and DTC stocks were hit especially hard. The YDTC Index had one of its steepest single-day drops on that date. Since then, it has struggled to regain its early-year momentum, lagging behind the S&P 500 in subsequent months. In short, DTC eCommerce went from leading the pack to playing catch-up after that tariff scare. (Notably, many brands began factoring the tariff impact into their guidance, and investors grew skittish about rising costs – a theme that kept DTC valuations subdued over the summer).
- Modest Growth for Most, But Standout Winners Exist: Based on the latest earnings, the median company in the Yotpo DTC Index has grown revenue roughly 3% year-to-date in 2025 – a tepid single-digit pace that underscores the challenging environment. Many brands are essentially flat or only slightly up versus last year. Yet, a handful of stars are bucking the trend with explosive growth. For example, e.l.f. Beauty reported a 28% net sales increase in fiscal 2025 – building on its hot streak as a value-priced cosmetics brand riding high on social media buzz. Canadian fashion retailer Aritzia stunned with nearly 38% revenue growth in its latest quarter (Q4 FY2025), as its expansion into the U.S. market gained traction. Digital-native beauty innovator Oddity Tech posted 26% year-over-year sales growth through the first nine months of 2025, and telehealth platform Hims & Hers saw revenue surge ~49 – 73% in recent quarters, capitalizing on strong subscriber gains and new product offerings. These outliers prove that high growth is still achievable in DTC – but it’s concentrated in brands with unique product-market fit or exceptional execution.
- Efficiency and Profitability are Front and Center: One common thread in earnings calls this year is a near-obsessive focus on operational excellence, cost control, and profitability. After years of “growth at all costs” mentality, DTC brands big and small have shifted to proving they can be financially sustainable. Investors, frankly, have been rewarding companies that show they can control their own destiny (i.e. generate profit or at least shrink losses), and punishing those that haven’t adjusted. For example, Warby Parker – a company in our index often compared with Allbirds as a fellow “former DTC darling” – has managed to keep growing while also improving margins and avoiding heavy losses. In Q3 2025, Warby Parker’s revenue jumped 15.2% and active customers grew ~9%, and importantly, the company achieved a profitable quarter with expanding EBITDA, thanks to initiatives like in-house lens labs and disciplined marketing spend. Its stock and investor sentiment have responded favorably to these “sustainable growth” signals. In contrast, Allbirds (to continue that comparison) saw revenues plummet over 20% and is still in the red, so it’s been harshly punished in the market (their stock hit all-time lows and faces Nasdaq delisting risk). The lesson is clear across the board: DTC brands are being evaluated not just on growth, but on how efficiently and profitably they can deliver that growth. Our AI Topic Analysis shows “Gross margins”, “inventory levels”, and “ROI on marketing spend” are under the microscope across the board. Many index companies have responded by slashing marketing budgets, optimizing fulfillment costs, and tightening up inventory. The era of endless customer acquisition burn is over – and the era of disciplined DTC is here.
- Diversified Revenue Streams Win Favor: Another insight from our analysis is that financial markets are rewarding companies finding creative new revenue streams or channels, especially those that leverage omnichannel strategies. In other words, brands that aren’t just reliant on their DTC website, but can grow through stores, partnerships, or new product lines, are seeing a boost. A case in point is Warby Parker (again) – not only has it been expanding its own retail stores (over 300 and counting), but it struck a notable partnership with Target this year. Warby Parker opened its first shop-in-shop locations inside Target stores in 2025, bringing Warby’s eyewear and even eye-exam services to Target shoppers. This move gives Warby access to new customers in a high-foot-traffic environment and creates an additional revenue channel (all while Target benefits from offering a trendy brand in-store). Investors have viewed such partnerships as smart, accretive moves that extend a DTC brand’s reach. Similarly, Lululemon – known for its community-driven stores and DTC ethos – has leaned heavily into international expansion, notably in China. That’s paying off: China has been Lululemon’s standout growth market, with revenues there projected to jump 25% this year, even as North American sales flatten out. We’ve seen other examples too: some digitally-native brands are entering wholesale/retail partnerships (hims & hers, for instance, selling through retail pharmacy chains in addition to DTC), or launching B2B divisions, or expanding into new product categories (Oddity’s telehealth launch, etc.). The big picture: 2025’s winners are often those proving they can grow across channels (while keeping their brand identity) – online, offline, domestic, international – rather than depending on a single source of revenue.

- Affordable Luxury and the ‘Lipstick Effect’: Amid inflation and tightened wallets, consumers haven’t stopped spending – but they have become more choosy, gravitating towards what economists call the “lipstick effect.” This concept is the tendency for consumers to splurge on small affordable luxuries in tough times (like a $10 lipstick) instead of expensive big-ticket items. We’re seeing this play out in the DTC Index. Categories like beauty, self-care, and accessible luxury are shining. For example, e.l.f. Beauty’s stellar growth suggests that shoppers are treating themselves to $6 lip glosses and $12 primers as little pick-me-ups, even if they’re avoiding higher-priced prestige cosmetics. The “affordable indulgence” trend is evident elsewhere too – jewelry and fashion jewelry DTC brands have noted steady demand, and even sneaker sales at the premium end have been robust as some consumers opt for a fresh pair of stylish shoes over, say, a costly vacation. This shift in consumer behavior – spending on feel-good, lower-cost treats while delaying larger purchases – has benefited a subset of DTC brands. It’s no coincidence that makeup sales historically rise in recessions (hence the lipstick index nickname). In 2025, we’d categorize the market as having a “lipstick effect” flavor: brands offering quality and little luxuries at reasonable price points are dominating. On the flip side, DTC brands selling high-priced durable goods have had a tougher go; for instance, those in luxury apparel (LVMH) or home goods have seen softer results as consumers pull back on big expenses.
- Pricing Power and DTC Expansion to Offset Costs: Facing rising costs (from product inflation to higher import tariffs), many DTC brands have taken the only sensible route: raise prices and optimize channel mix. Our research found that an overwhelming majority of eCommerce brands are not shy about price increases in 2025. According to one industry survey, 87% of online merchants said they have raised U.S. prices to counteract tariff impacts this year (passportglobal.com). DTC brands, in particular, often have a bit more pricing power because of their brand loyalty and the direct relationship with customers. We saw companies selectively upping prices on best-selling items or new launches to protect their margins. Additionally, many brands doubled down on their DTC channels (own website and stores) as a margin lever. Many brands encouraged more customers to shop direct through loyalty perks, exclusive products on their site, or expanding physical retail presences. For some companies, expanding DTC meant opening more brick-and-mortar stores where they control the full sale (as seen with Warby, Allbirds, and others continuing to open stores where economics make sense). For others, it meant investing in their eCommerce tech and marketing to drive more traffic to their own site versus marketplaces. And thus far, consumers seem to be stomaching the moderate price hikes, especially when communicated as improvements or bundled with added value. Of course, there’s a limit to this – too high and demand drops – so brands are walking a fine line, especially as historical stock runs out and more ‘tariff’ hit goods enter the market. But the ability to nudge prices up (and frankly, the necessity to do so because of inflation and tariffs) has been a defining feature of 2025’s DTC playbook.
Looking Ahead: Join Us in Shaping the DTC Index
As we launch the Yotpo DTC Index, we do so with a ton of excitement and a spirit of collaboration. This is just version 1.0 – with your feedback, we plan to continuously evolve the tool to make it even more insightful and user-friendly.
In the coming quarters, expect new features like interactive comparisons (want to compare a specific subset of brands? or see DTC index performance ex-Nike/Adidas? let us know!), deeper dives into specific sectors (e.g. beauty DTC vs apparel DTC), and more granular KPI tracking beyond just stock prices and revenue. We’ll also be refining our AI summaries to get ever closer to the “so what” behind the data – our aim is to eventually provide tailored insights for different roles (what a CMO cares about might differ from what an investor cares about, and we’d love to surface both).
For now, we invite you to explore the index yourself – check it out, play with the charts, and see how your favorite DTC brands are faring. You can find it at Yotpo.com/DTC-Index (no login required). If you’re as nerdy about eCommerce trends as we are, consider subscribing on that page to get the quarterly insights email – again, it’s free, and it’ll ensure you don’t miss the latest analysis we put out. At Yotpo, our mission has always been to help eCommerce brands not just survive, but thrive. We do it through our products – helping you build customer loyalty, leverage UGC, and create seamless shopping experiences – and now we’re doing it through data and thought leadership as well.
The DTC Index is an extension of that mission: giving back knowledge to the community that has given us so much.
We hope it empowers you to make more informed strategic decisions and maybe sparks some new ideas for growth. Thank you for reading this far and for being part of the journey. The future of DTC commerce will be shaped by those who understand the trends and adapt quickly – and we’re thrilled to be on that journey with you.
As the saying goes, knowledge is power, and with the Yotpo DTC Index, we aim to put a bit more of that power in your hands. Happy scaling, and see you in the data!
FAQs
- What is the Yotpo DTC Index?
The Yotpo DTC Index (“YDTC”) is a benchmark and insight tool composed of ~40 public companies with significant direct-to-consumer operations. It combines financial data with AI-generated insights from earnings call transcripts and analyst commentary.
- Who is it for?
The Index is designed for anyone invested in the DTC space, including operators, marketers, founders, consultants, and members of the broader eCommerce ecosystem.
- How was the Index built?
The Index was built using AI-native tools such as ChatGPT, Gemini, Lovable, and Claude, along with no-code automation platforms like n8n, a Supabase database, and Synthesia for video creation. It was developed without engineering resources, as an AI co-pilot project.
- Where does the data come from?
The Index uses financial data APIs (via FMP) to pull stock prices, market caps, revenue growth rates, and other financial metrics. It also uses AI to extract themes and sentiment from earnings call transcripts and analyst commentary.
- How is the Index calculated?
The Index is market-cap weighted, similar to major indices like the S&P 500. Larger companies have a greater impact on movement. The Index value is calculated as if all included companies were components of one stock index.
- Which companies are included?
The Index includes a mix of:
-
- Digital-native DTC brands (e.g., Warby Parker, Allbirds, Hims & Hers, Oddity Tech)
- Established retailers with large DTC segments (e.g., Nike, Adidas, Lululemon, Aritzia)
- Consumer product companies with strong DTC components (e.g., e.l.f. Beauty)Companies must be public and have meaningful revenue from direct channels relative to their industry.
- Digital-native DTC brands (e.g., Warby Parker, Allbirds, Hims & Hers, Oddity Tech)
- Can I invest in the Yotpo DTC Index?
No. The Index is a benchmark computed for insights and is not an investable security.
- How often is it updated?
The Index is updated each earnings cycle, with AI-generated summaries published every quarter after all companies have reported. Users can subscribe on the DTC Index page to receive these insights via email.
- What types of insights does the Index surface?
The Index highlights themes mentioned by company leadership and analysts during earnings discussions – for example:- Tariff impacts
- Revenue growth trends
- Operational efficiency
- Profitability and cost controls
- Diversified revenue strategies
- Consumer behavior patterns like the “lipstick effect”
- How can I provide feedback or request features?
There is a feedback form within the tool where users can suggest metrics, features, or improvements. The team plans to refine and expand the Index based on community input.
