

To make your ecommerce business a success, tracking ecommerce metrics that
impact your store’s revenue is an absolute must. Keeping your fingers crossed and merely checking the total sales at the end of the month isn’t a great way to measure your store’s performance.
In this article, we’ll show you what top ecommerce KPIs (Key Performance Indicators) and metrics you should track and optimize to build your ecommerce empire. But first, let’s understand what metrics and KPIs are.
Metrics and KPIs play a crucial role in any ecommerce marketing strategy.
Ecommerce metrics define your website’s performance, and by analyzing them, you can understand the scope of improvement for your business.
Some marketers use ecommerce metrics and KPIs interchangeably, but they are not precisely the same.
Let’s look at an example to understand these two concepts’ differences.
The average order value of your store is a metric, but an average order value of $30 is a KPI.
In simple English, metrics track your business progress, and KPIs show how effectively you achieve your goals. KPIs are goal-oriented, and they use metrics to measure how close or far away you are from reaching those goals.
This means: All KPIs are metrics, but not all are.
Another way to deal with the metric selection is by leveraging the SMART system.
SMART is an abbreviation for:
Pro tip: Make a list of all KPIs by asking the three questions mentioned earlier, and then use the SMART approach as a filter to further shortlist the best KPIs and metrics you can measure.
Every ecommerce metric needs a different tracking frequency. Some metrics need to be tracked weekly, while it’s ok for some to be tracked quarterly.
Here are the four-time frames one could track ecommerce metrics:
Whatever niche your ecommerce store is in, you will be using email marketing one way or another. This can be for promotions, customer care, or retargeting.
Tracking how your email marketing campaigns perform is the first thing to do.
Let’s see the key metrics you can track when doing email marketing.
The click-to-open rate is the best way to measure your email campaign’s success.
You can do so with this formula:

By measuring the click-to-open rate, you get an idea of what your emails have:
Note: For any email campaign you run, ensure your click-to-open rate is not less than 10%.
For any ecommerce business, the ultimate goal is to make a sale. Tracking your email conversion emails is the most critical ecommerce metric.
The conversion rate can be calculated as follows:

You can further multiply the result by 100 to get a percentage value.
Here’s what conversion rate you can expect from your email campaigns.
When you have many subscribers, the unsubscribe rate comes into the picture. Retaining old customers and keeping them hooked on your brand will increase sales.
Think of why people are unsubscribing from your email newsletters. Is it because you send too many emails? Or simply because of poor user experience?
Whatever the reason, try bringing the unsubscribe rate down with every campaign you run.
In ecommerce, you can expect around a 0.3% unsubscribe rate when doing email marketing.
To track all essential email marketing KPIs, you can leverage Omnisend.
Omnisend has an email automation feature through which you can run campaigns and track critical metrics and KPIs simultaneously.
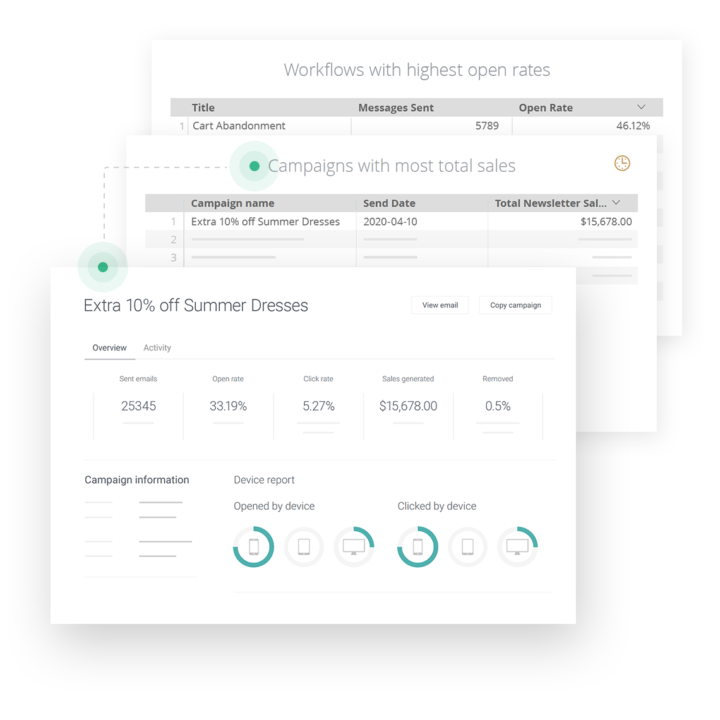
You can get started with Omnisend for free, including all the premium plan features, and see how it fits your brand.
Whatever your traffic source is, tracking metrics that tell you about your store’s performance and optimizing them should be your ultimate goal.
Let’s see what key metrics and KPIs you can’t ignore.
Cost per acquisition is the total cost you spend on acquiring a new customer.
This can be calculated with a simple formula:

Here’s an example of how to calculate CPA:
In November, Jack invested $10,000 in marketing for his online shoe store. He was able to acquire 500 new customers.
Jack’s CPA will be $10000/500 = $20.
This means that Jack spent 20 dollars to acquire one customer in November.
Note: To have a profitable ecommerce store, the average order value should always be greater than the cost per acquisition. Simply put, you shouldn’t pay more to get a customer than what they spend on your store.
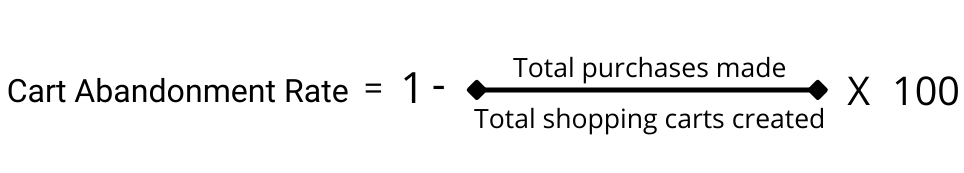
The cart abandonment rate is the percentage of people who have visited your store and added a product to their shopping cart but didn’t buy it for some reason.
You can boost conversion rates byretargeting these cart abandoners since this audience has shown specific interest in your product.
According to Sleeknote, the average shopping cart abandonment rate is 69.57%. More than half the traffic visiting your store will abandon their cart.
So keeping an eye on the abandonment rate and converting abandoners into buyers is what you want to do. It may sound complicated, but it’s pretty straightforward: use a marketing automation platform like Omnisend to automatically send one or a series of cart abandonment emails to catch those shoppers soon after they’ve abandoned their carts.
Here’s the formula to calculate the cart abandonment rate:
AOV is the average amount of money spent each time a customer orders something from your store. This can be for one product or multiple products bought together in one order.
The formula for AOV is relatively straightforward:

Tracking AOV as an ecommerce metric helps you set benchmarks and goals for the future.
Some marketers consider AOV to be one of the vital ecommerce metrics. Why?
Increasing traffic or optimizing your store for conversions will cost you, but you can increase AOV without spending a penny by getting shoppers to buy more products in each order.
Here’s how:
Regarding ecommerce, the customer retention rate represents the number of customers who buy from you repeatedly over a given period.
To calculate CRR, you need to have three values:
When you have all three values, just put them in the formula below:

Did You Know: The average CRR for the ecommerce industry is 30%. So try keeping your store’s CRR below 30%.
CLV represents the total amount of money a shopper is expected to spend on your store’s products or services in their lifetime as your customer.
Knowing CLV is crucial as it helps you decide your CPA and CRR optimization investment.
CLV is calculated based on three values:
CLV = Average order value X No. of times the customer will buy from you each year X The average length of the customer relationship (in years)
So suppose a baseball player buys a bat worth $200 from your store thrice a year.
He has done the same for five years. Therefore his CLV would be:
CLV = $200 X 3 X 5 = $3000
The ecommerce churn rate calculates the percentage of customers a business loses in a given time frame. The formula is:

If you have 200 sales at the start of November and it drops to 180 at the end of the month, the ecommerce churn rate will be:
[(200-180)/200]X100 = 10%
The net promoter score is an ecommerce metric that tells you how many customers are willing to recommend your product to others.
Tracking this will give you a clear understanding of where your business is regarding customer satisfaction and brand loyalty.
To calculate the NPS, you must understand what promoters and detractors are.
Your promoters are loyal customers who recommend your products to their friends and family, whereas the detractors are the unhappy customers who won’t recommend you to anyone.
NPS = %Promoters – %Detractors
It would be best if you had robust tools to track these key metrics and KPIs for ecommerce businesses.
You can use Google Analytics to track these ecommerce search and performance metrics. But to track email metrics, a tool like Omnisend that lets you do it for free initially is a great way to start using these metrics without having to calculate them yourself.
#Bonus: When tracking the essential metrics and KPIs, one best practice is setting benchmarks by analyzing your base metrics for a given period and then ensuring you improve upon them. Do this, and you will see your business grow over time.
Get started with Omnisend today & drive sales on autopilot with pre-built automation workflows at Omnisend.

