

Track these customer support metrics, improve them, and watch your customer loyalty rise.
When you keep an eye on your customer support metrics, you can make sure that your ecom brand is delivering stand-out customer support. This makes your customers feel valued and increases the likelihood of them buying from you again.
But customer service is complicated.
You might have dozens of support tickets streaming in each day, or potentially every hour.
In this post, we dive into why it’s important to track customer service, present customer support metrics you should measure, and offer strategic advice on raising your overall support quality.
When it comes to ecommerce tracking, your mind probably doesn’t go to customer support first. You might think of tracking inventory, orders, and marketing campaigns.
But, your customer support should be accurately measured too. Here’s why:
90% of American consumers say that customer service is a deciding factor in whether or not they will do business with a company. Potential customers might ask a question about delivery or the product. If they’re not satisfied with the support experience (if it’s too slow, or the customer service representative is rude), there’s a good chance they won’t buy from you—ever.
Because existing customers are your biggest spenders, it only takes a 5% boost in customer retention to increase your profits by 25% to 95%. Loyal customers will re-purchase again and again. But if your customer support fails to impress, customers might churn.
73% of consumers say that customer experience is an important factor in their purchasing decisions. Customer experience includes customer service, but also post-purchasing interactions like shipping updates and ease of returns.
It’s important to provide a consistent experience. You don’t want to give fast and accurate support one day and then slow and confused support the next. When you track customer support metrics, you can ensure that consistency.
Is your customer support well staffed? Do you need new training? Is it time for a help desk software that includes templates and automations? When you track your customer support, you can discover issues with the overall program.
Tracking customer support metrics can also help you identify specific areas of improvement. For example, if your average resolution time is longer than 8 hours, you can explore ways to fix this. You might create new pre-made responses or edit your existing templates.
While there are potentially hundreds of different customer support metrics that you could track, not all of them are essential. Below are the most important metrics that will give you insights into the state of your customer support, without overwhelming you.
Some of these customer service KPIs can be tracked with your help desk software, and others will require a survey or feedback tool.
Top customer support metrics to track:
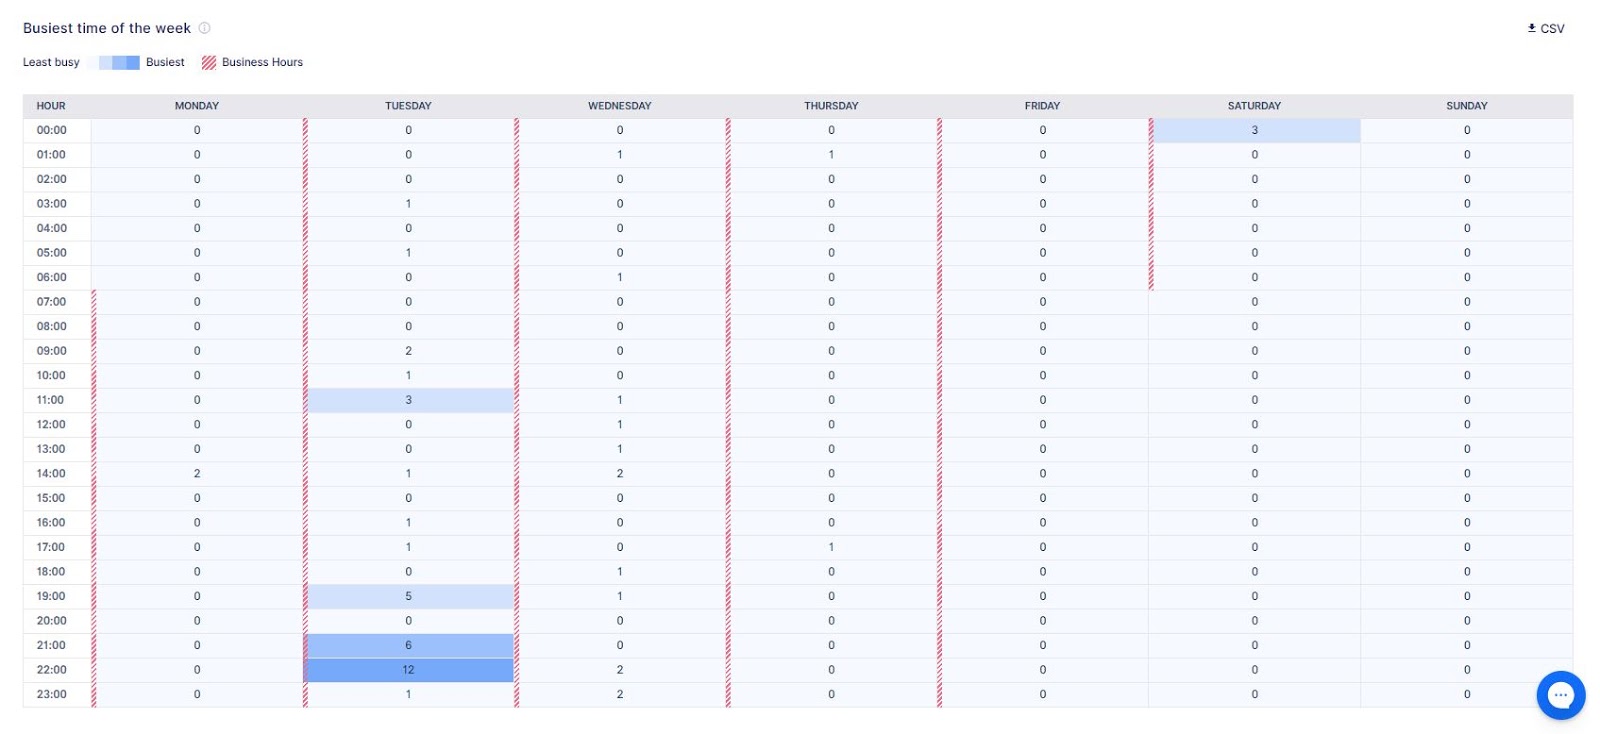
While tracking the volume of your tickets might not seem very useful, it absolutely can be. You should track your ticket volume by day, week, month, and quarter. If you have a very active ecommerce store, it could help to track the volume by hour as well.
Here are some use cases:
The number of unresolved tickets is a very important metric to track. You don’t want too many unresolved tickets piling up. Set a company wide goal for the maximum number of unresolved tickets per day, week, and month.
The average resolution time refers to how long it takes for your customer service team to resolve tickets. Inside of Gorgias, your average resolution time is automatically tracked. In your account, you’ll get visual reports showing you how this average time compares to other time periods.
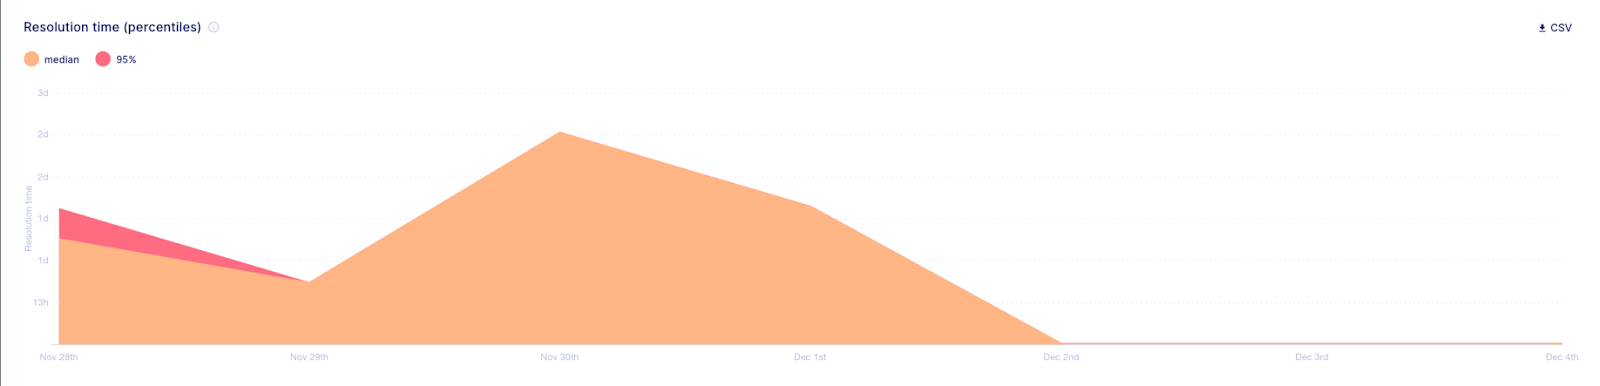
We analyzed data across ±6,000 ecommerce companies using Gorgias to provide customer support and we found that the top performing companies have an average resolution time of 1.67 hours.
Your average response time refers to how long it takes for you to respond to any customer support message, not just the first message of a ticket. Your average response time should be similar to the first response time. You don’t want to keep customers waiting when they reply to your responses.
It’s important to track this metric for different given time periods, such as per week, per month, and per year.
This customer support metric tracks how long it takes for you to reply to the first message in a ticket. Inside of Gorgias, you can track your average first response time using visual statistics reports that make it easy to spot trends, changes, and issues.
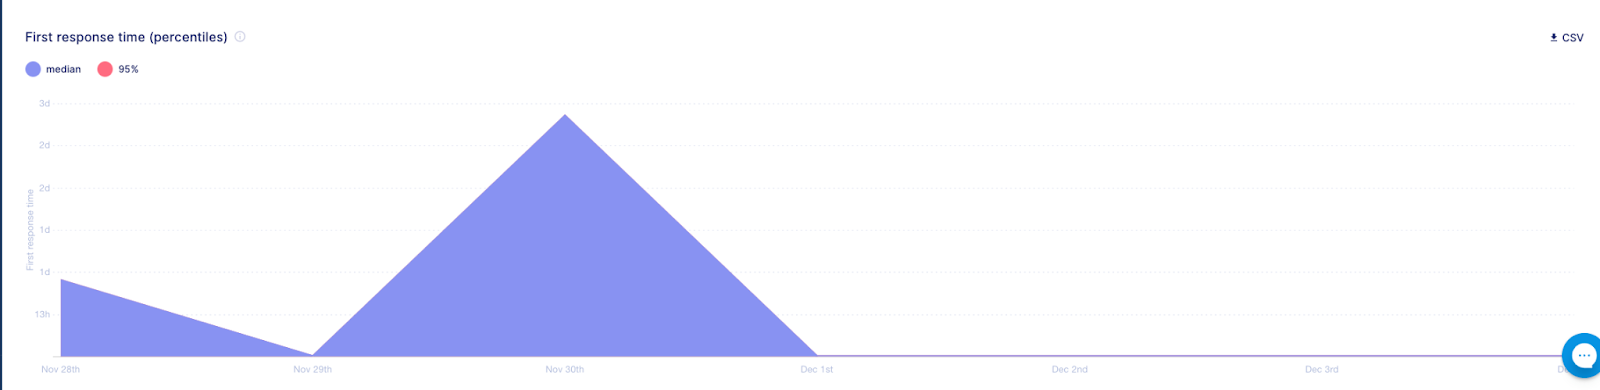
Top performing companies using Gorgias have an average first response time of .54 hours.
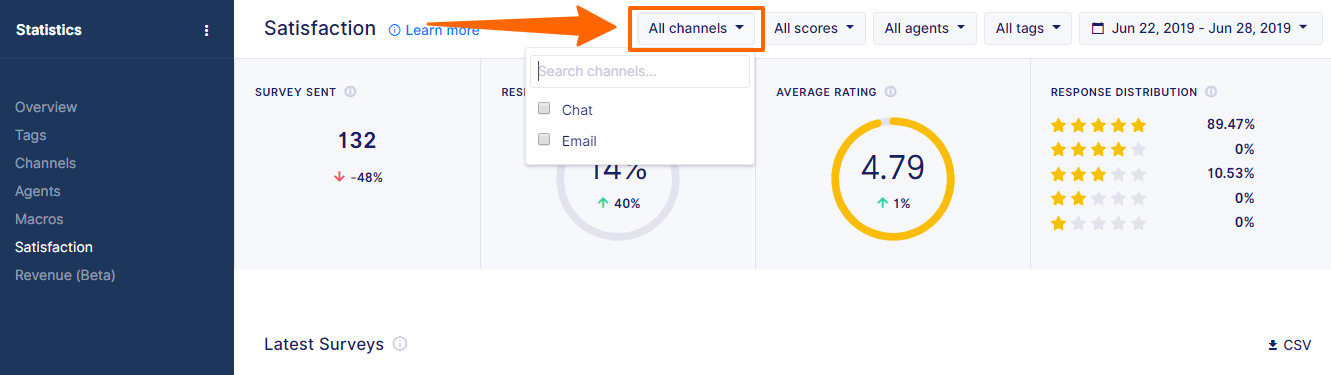
The CSAT is a common customer support metric. It summarizes responses to a very simple question. You can use a survey or a website feedback widget to ask customers to rate on a scale of 1 to 5 how satisfied they are with your business.
This score does not measure feedback for individual products or customer service interactions. Rather, its aim is to get an overall benchmark for how customers feel about your business. If this score suddenly drops or peaks, you should look into why that might be. For example, a new flopped product line could be to blame.
You know what customers absolutely love? When they can get their issues resolved with a single reply. The single-reply resolution rate calculates what percentage of your tickets are handled with the first reply. It’s also known as the first contact resolution rate or FCR.
Single-reply resolution rate = Total number of requests resolved with one interaction in a single time period divided by the total number of requests in the same time period. 8. Average ticket handling time
The average ticket handling time (AHT) is an important metric to track if you offer customer service via phone. In today’s online world, most ecommerce companies handle tickets only with chat and email. However, very large ecommerce brands may choose to provide phone support as well.
The average ticket handline time includes the total talk time and total hold time for that caller. You can calculate the average for larger periods of time to get better insights, such as per week or per month. Calculating this customer support metric by day or by hour likely won’t be useful.
Want to know how well your automated support can resolve tickets? You can separate out tickets that did not have a customer support representative work on them, and that were only resolved with an automated response.
Automated support resolution rate = Total number of requests resolved with only automation in a single time period divided by the total number of requests resolved with automation, manual support, and a combination of both (in the same time period).
How frequently your brand is mentioned on social media is a critical metric to track if you want to provide incredible support and get on top of PR disasters. You should have a good benchmark for how often your brand is mentioned per day and per week. If the number spikes, then one of your products might have gone viral, or you’ve got a PR nightmare happening.
You can pay attention to brand mentions with a social listening and brand monitoring software. It’s also smart to use a help desk built to manage social comments.
Customers’ issues do not only exist in your desired support channels like email and chat. Do you get support tickets taking place in social media? Rather than fight against this trend and attempt to ask customers to submit a ticket via chat, you should respond and help them. Just don’t share sensitive data of course.
Measure the number of social media support tickets that you get every day, week, month, and quarter. When that number grows, it’s not necessarily a bad thing. It could mean that more of your customers are interacting with your social media profiles. However, it’s still important to pay attention to the benchmark metrics. Sudden changes could represent an issue with your product or shipping speeds.
Similar to the CSAT, the NPS is a common metric for measuring customer satisfaction. Customers will rate on a scale from 1 to 10 how likely they are to recommend your business to a friend. It’s best to measure this regularly, so you can determine your company’s benchmark and look for any drops or spikes in the average rating.
You can use a feedback widget on your website to collect this data, or include the quick survey at the bottom of emails for transaction or shipping updates.
How many converted tickets do you have per week, per month, and per year? This is a great metric to track because it shows you the value of customer support. Converted tickets are those support tickets which lead to a purchase within 5 days. For example, new customers might ask about product sizing or returns. Successful responses can build deeper customer relationships.
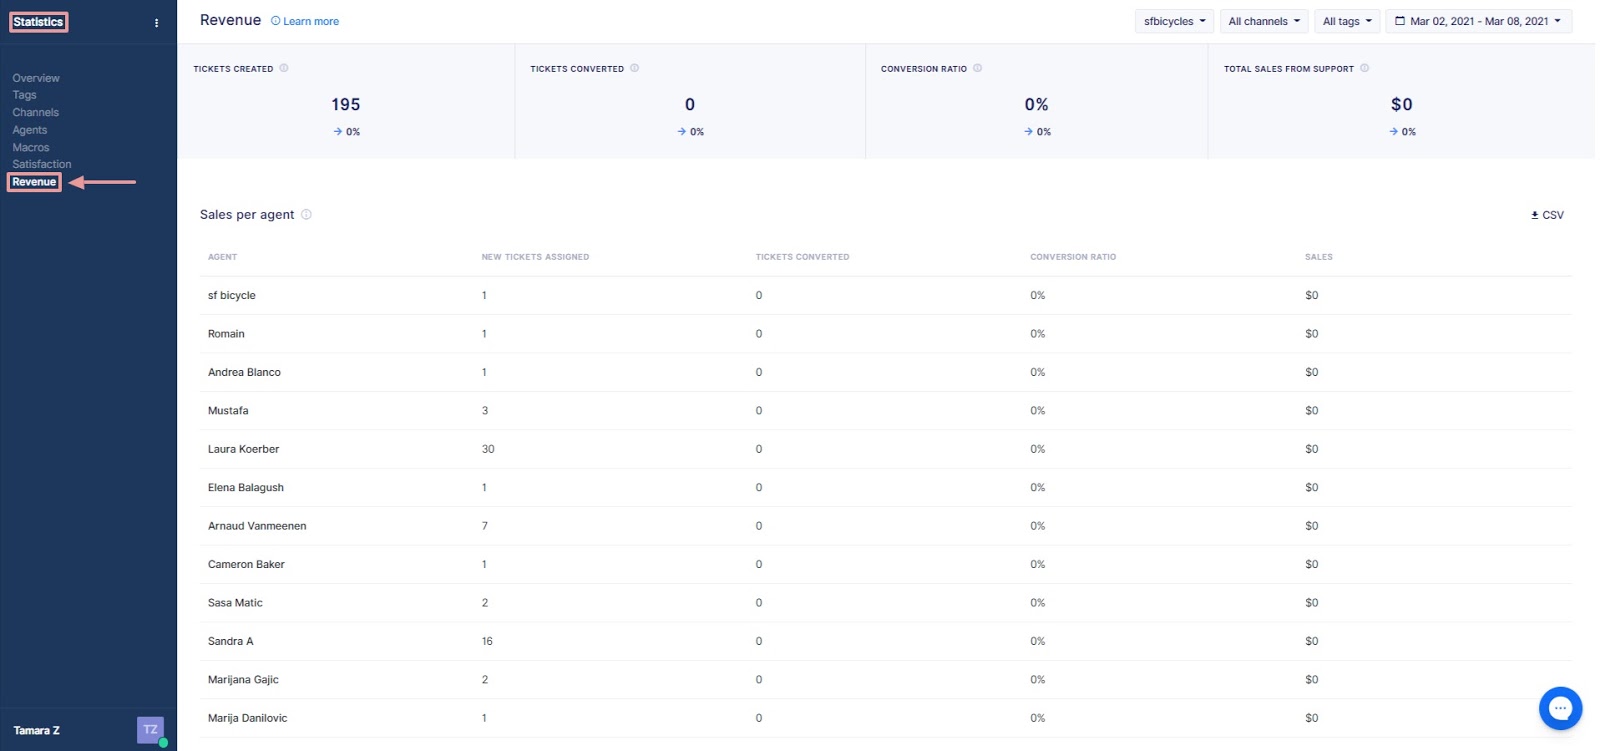
With Gorgias, you can measure this and other revenue statistics. Converted tickets can be from automated and manual responses.
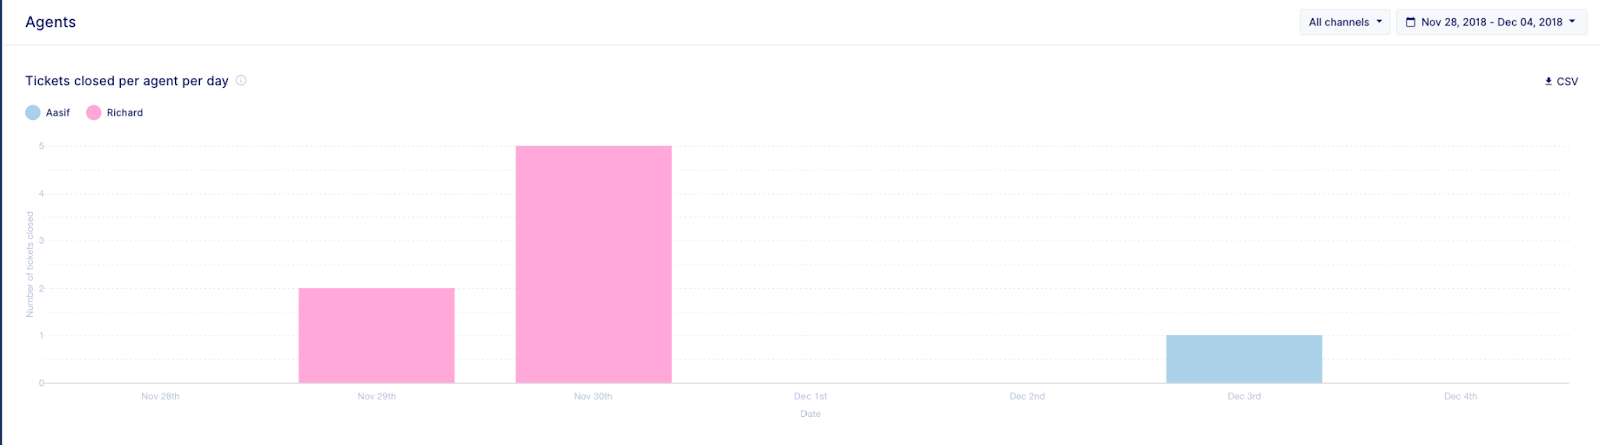
You might also want to measure the number of tickets closed per agent for a certain time period. For example, you could look at the number of tickets each agent is closing per day to spot differences in productivity. You could look at a longer period of time, such as per month, to find which agents are consistently closing more tickets, assuming they each work the same number of hours.
This will help you discover the agents who deserve praise and bonuses, and which ones might need training. If you find an agent that is always closing too few tickets, it may be time to let them go unfortunately.
With Gorgias, this metric is automatically tracked in your account.
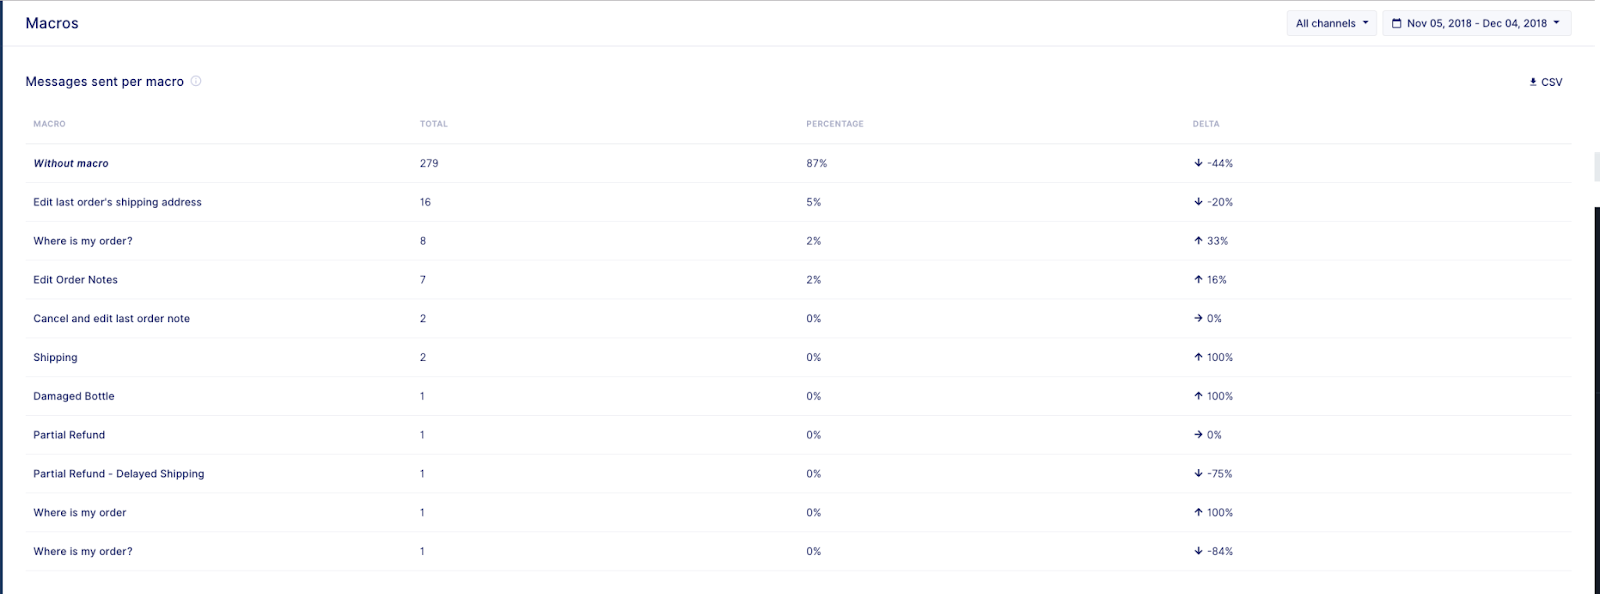
Creating templated responses saves a lot of time. But creating the templates is half the battle. You also need to make sure that your agents are actually using these templates. To do this, you’ll need a help desk software that offers pre-written responses. At Gorgias, we call these Macros.
You can get statistics on the utilization of your Macros in any given time period. You can then compare this to the use of tags. For example, if the tag “Cancel Order” was used 100 times in one week, but the Macro was only used 50 times, then that means that your reps only used the Macro half the time.
Talk with your reps about why they’re underutilizing certain Macros. You might need to improve the copy of the Macros or add more variables to make it more useful. Or, you might simply need to remind new reps about the Macros feature.
When you improve your customer support, you increase the likelihood of first-time and repeat purchases. Here’s how to improve.
The consistent presentation of a brand has been proven to increase revenue by 33%. That consistency should extend to your customer support responses. When you templatize your responses, you experience a few different benefits:
A slow wait time is an easy way to increase customer satisfaction.
There are so many different variables you can use in your templates reponses, including:
With advanced variables, you can automatically resolve dozens of tickets every day. Check out all of the variables here.
Automation can handle lots of responses. But some tickets will require manual effort. And, you still need great customer service agents who can craft your automated templates and build out your knowledge base for more self-service. For best results, hire customer support team members with experience working for ecommerce companies or consumer brands.
Help them grow in their careers by offering two types of training: soft skills and technical skills. Upskill them in ecommerce support automation and technology, while also training them in empathy and listening.
With the right metrics, you can make smarter decisions about staffing, training, and systematization.
Ultimately, one bad customer experience—whether from an unhelpful response or a long resolution time frame—can negatively affect the customer journey. Satisfied customers not only want great products, but top notch support.
Measure and improve your customer support metrics with Gorgias:

