

Conversion rates tell you how well your website turns visitors into paying customers.
Improving your conversion rate is about appealing to customer behavior and buying habits.
But getting your customers to click isn’t easy, especially with all the noise online today.
Does your customers’ behavior feel like a mystery to you? How can you possibly know what your site visitors are thinking?
You can start answering these questions by unpacking your site analytics. I’ve spoken to some ecommerce experts to learn what reports help you better understand your site visitors and optimize your website.
Below are five Google Analytics and Shopify reports that unearth the information you need to increase your conversion rates and sales.
Note: Running these reports won’t immediately increase your conversion rates. To improve your ecommerce CRO, consider setting goals against which you can compare your site performance. Learn more about setting up goals for Google Analytics here.
The first-time versus returning customer sales report shows the value of orders placed by first-time and returning customers.
New traffic is exciting, but your number of returning visitors indicates that your website, product, and purchase experience left a positive impression.
Run this report in your Shopify admin by clicking Analytics > Customers > First-time vs returning customer sales.
You can click “Group by” to select the time unit that you want to view the total sales by in the graph:
The key to increasing ecommerce CRO is understanding your audience and how they shop—new and returning visitors have very different buying habits.
According to a 2018 study, returning visitors:
Why? A new visitor is likely browsing your site and getting familiar with your products, similar to a window shopper. Unless they came to your site via word-of-mouth, they might not be looking to make a purchase immediately.
You can use newsletter prompts, pop-up discounts, and cart abandonment emails to engage with new visitors if they make a purchase; great! If not, use these levers to provide a pleasant experience, build a positive relationship, and encourage them to return.
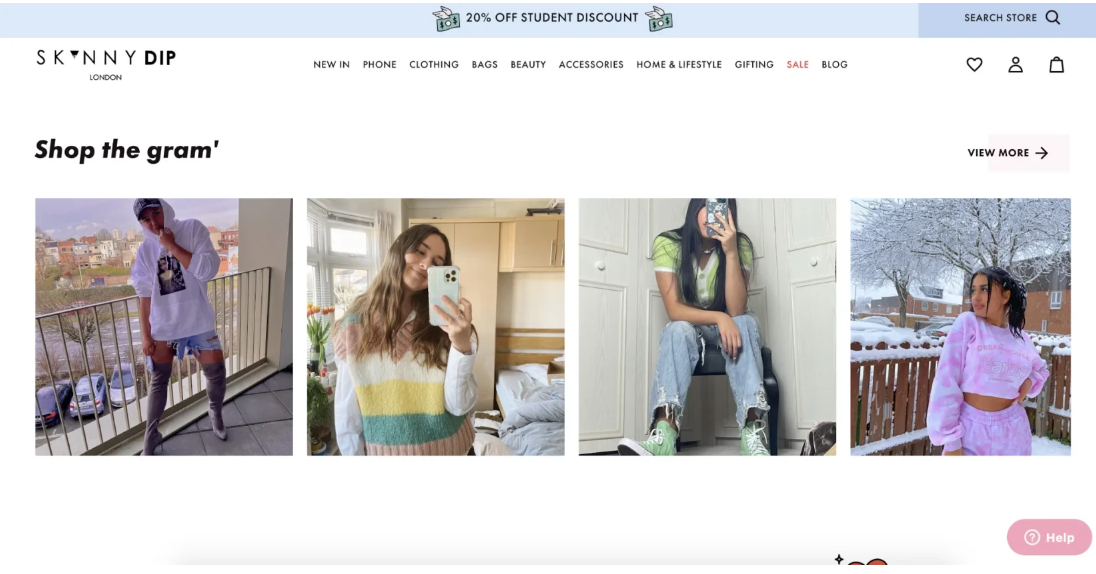
On the other hand, returning visitors are already familiar with your store and probably visiting to shop (if they haven’t already). The best way to welcome return visitors to your website is with ecommerce personalization tactics like customized product suggestions and user-generated content. Consider including the latter on your product pages alongside professional product photography.
Not only does ecommerce personalization make returning visitors feel recognized, but it may also cut their path to purchase in half. Personalized shopping experiences have yielded up to 15% higher conversion rates.
How does your website acquire traffic? Once people land on your site, where do they go from there?
Run this report in Google Analytics by clicking Acquisition > All Traffic > Source/Medium.
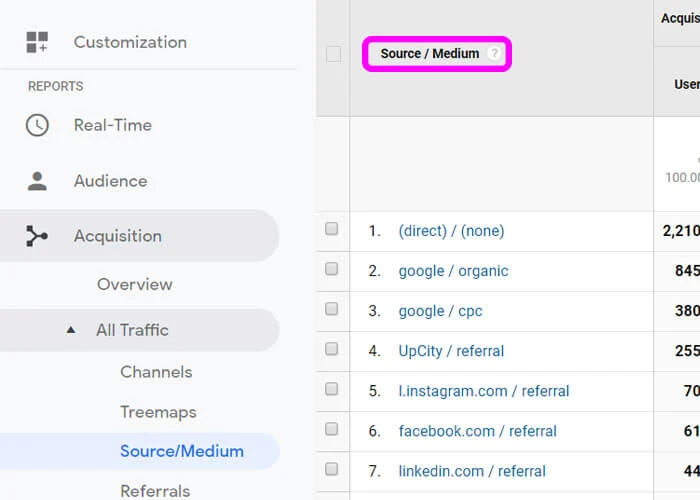
First, if paid campaigns aren’t driving traffic, this report will show you where to tweak your projects. Are your Google ads barely making a dent? Turn them off and reroute those efforts into organic social media or email campaigns that may attract more visitors.
You can use this report to trace your user experience for those digital marketing campaigns driving traffic. This is particularly helpful if you see high traffic but low conversion rates.
Do all paid ads, social posts, and email campaigns match the landing pages they link? If not—and your visitors expect a different product or offer—this could be the culprit of a low ecommerce conversion rate.
Another variation of this overview report is the Users Flow report in Google Analytics. This visually represents visitor traffic, from where they entered your site to what pages they visited and where they exited (which we’ll unpack next).
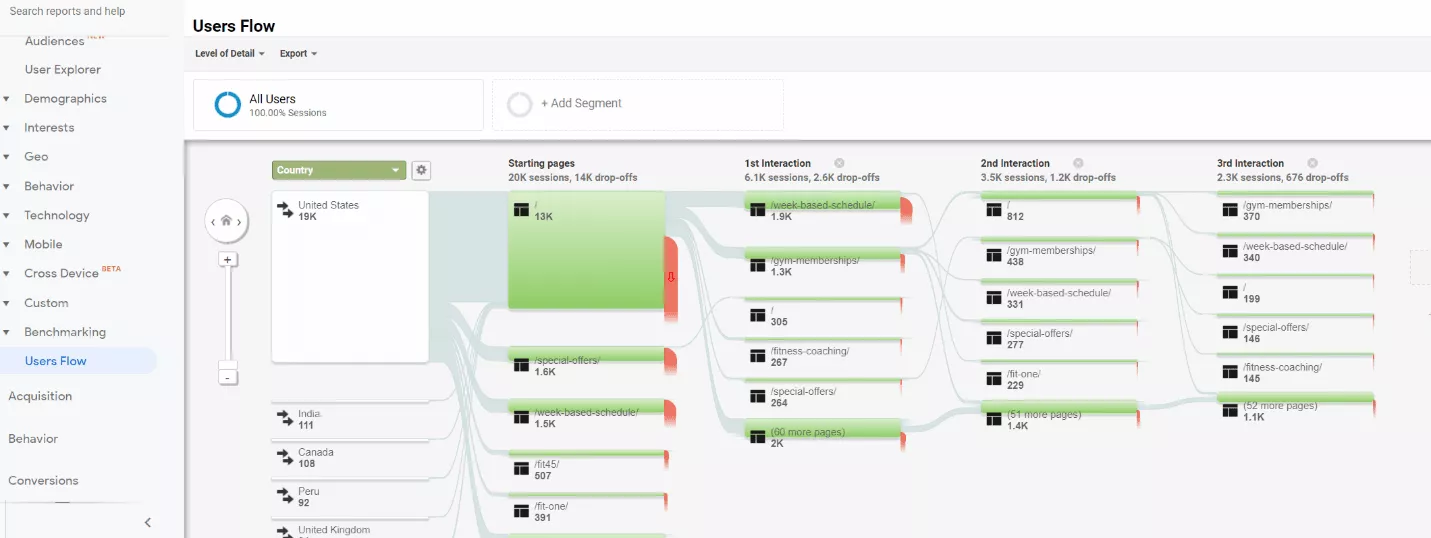
The Users Flow report is a helpful addition to your acquisition analysis, as it identifies any loops.
“A loop occurs when visitors repeatedly navigate back and forth between two pages, such as clicking from the homepage to a product grid page then back to the homepage,” says Jon MacDonald, founder of The Good.
Loops may indicate confusion on a particular page. This insight lets you clear the information and help visitors become customers.”
The pages on which your visitors choose to exit your site reveal where your user experience is lacking—or breaking altogether. While the Users Flow report provides this information, we encourage you to run an Exit Pages report to dig deeper into where your visitors left your site.
Run this report in Google Analytics by clicking Behavior > Site Content > Exit Pages. You can also see exit rates under All Pages.
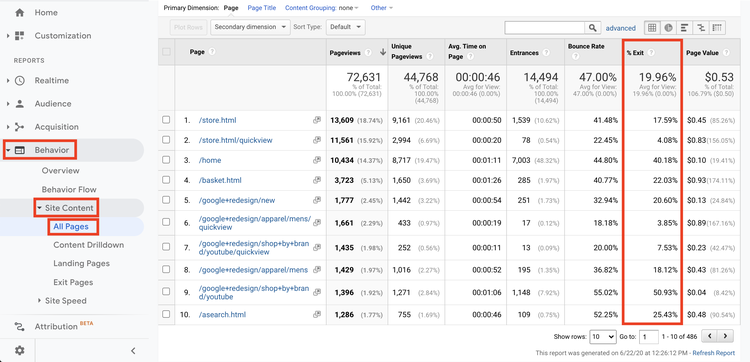
Narrow down your Exit Pages report results by filtering out pages not intended to produce a continued action (e.g., an informational page like About Us). Do this by clicking Advanced and adding a filter for page URLs containing “/product/”—or whatever URL path you’ve set up for your site.
Could you look over the specific pages from which visitors are frequently exiting? Don’t worry if your homepage is at the top of the list—that’s pretty common. If they’re product or high-intent pages, like a Contact Us page, review your website copy, product imagery, and customer reviews.
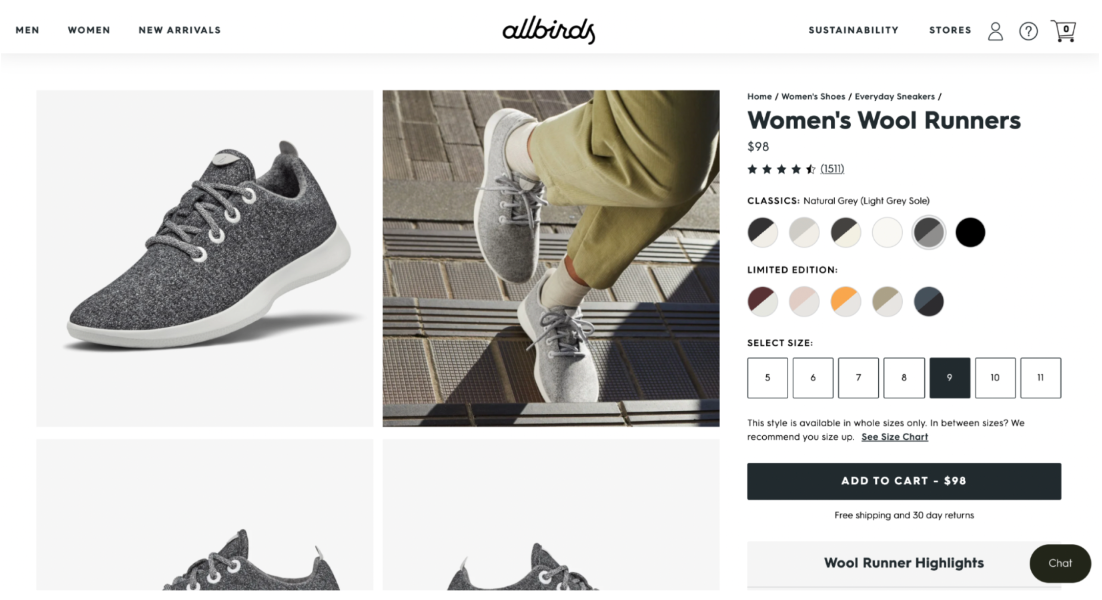
Could you look over how each page is designed? CRO expert Alex Birkett encourages merchants to review what information lives below the fold.
“Consider setting up Scroll Depth triggers in Google Analytics to see how far your visitors travel on each page,” he says. “If [visitors] are not seeing important information like pricing or calls to action, consider reorganizing the page or driving people lower with arrows, continued imagery, and compelling copy.”
Allbirds vertically displays its product photography across each page, encouraging visitors to continue scrolling to see the rest.
Could you look over the specific pages from which visitors are frequently exiting? Don’t worry if your homepage is at the top of the list—that’s pretty common. If they’re product or high-intent pages, like a Contact Us page, review your website copy, product imagery, and customer reviews.
Could you look over how each page is designed? CRO expert Alex Birkett encourages merchants to review what information lives below the fold:
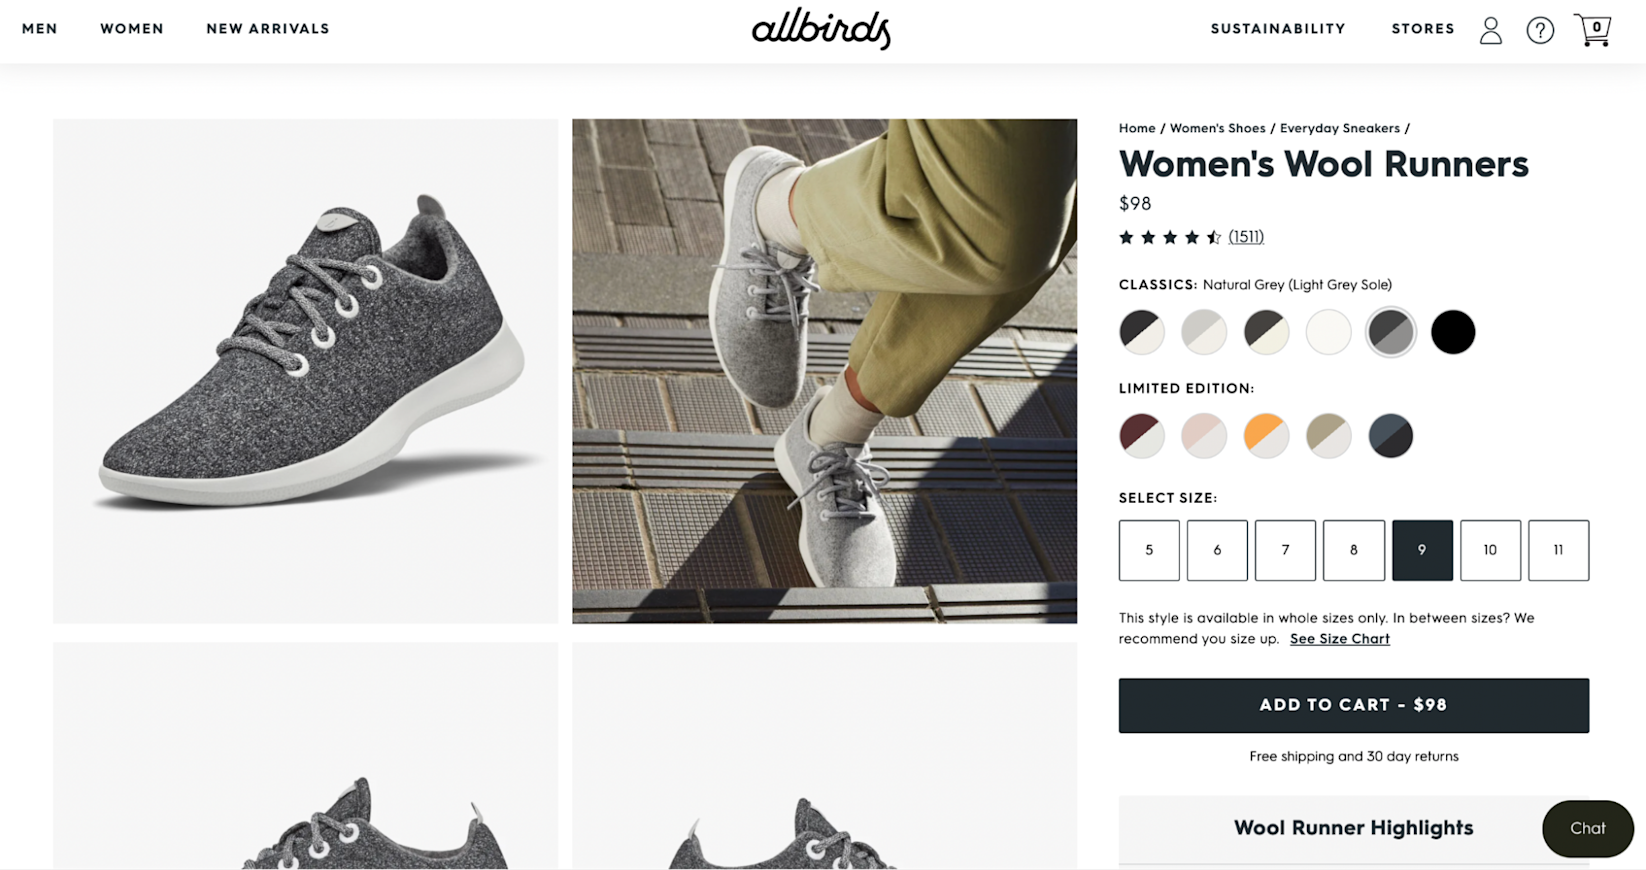
Consider setting up Scroll Depth triggers in Google Analytics to see how far your visitors travel on each page,” he says.
If [visitors] are not seeing important information like pricing or calls to action, consider reorganizing the page or driving people lower with arrows, continued imagery, and compelling copy.”
Allbirds vertically displays its product photography across each page, encouraging visitors to continue scrolling to see the rest.
If visitors leave a cart page, consider setting up a cart abandonment campaign to bring them back to your site. (The average desktop cart abandonment rate is about 70%; a simple drip email campaign can be a valuable second chance at a first impression.)
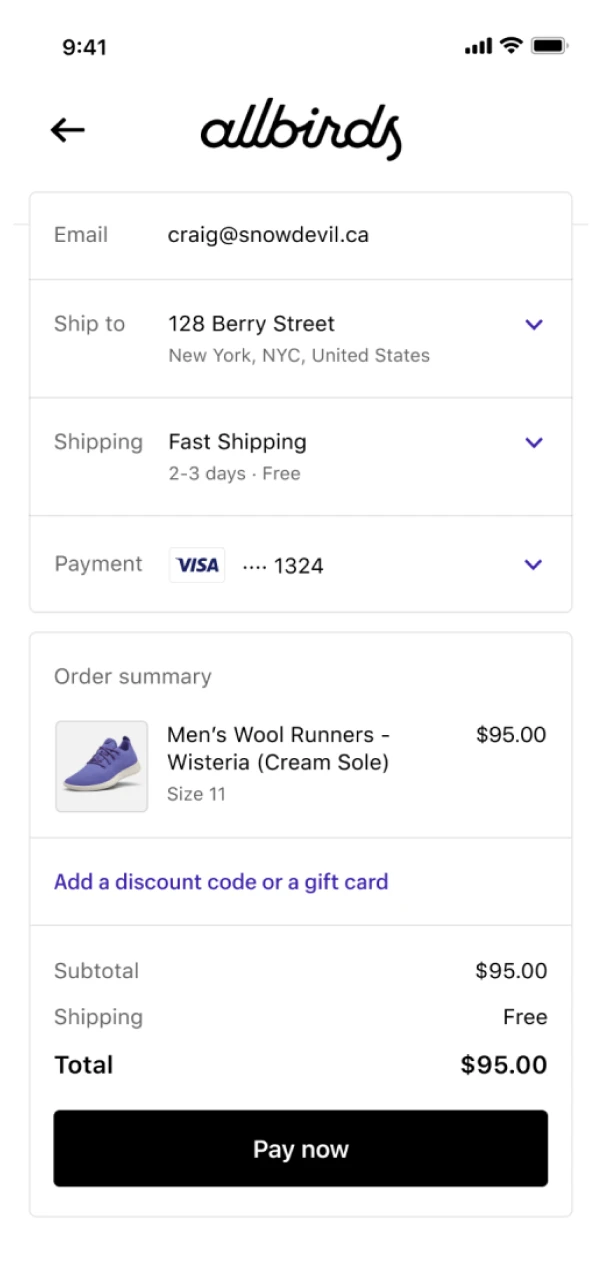
Another way to mitigate cart abandonment is with a simple checkout experience. If visitors can’t find it, don’t trust it, or don’t feel like navigating through it, they likely won’t convert to customers.
Your ecommerce checkout experience directly affects the success of your store—18% of visitors abandon their cart due to a complicated checkout process. A simple one-click checkout (like Shop Pay) has been shown to increase conversion rates by 35%.
As we acknowledged before, when improving your e-commerce website, CRO is about appealing to how your customers shop. One way to do this is by meeting them where they are—by understanding whether they shop on their desktop, mobile device, or tablet.
Your Sessions by Device report in Shopify shows you what devices visitors are using to access your site. You can also see a breakdown of this data on your Overview dashboard.
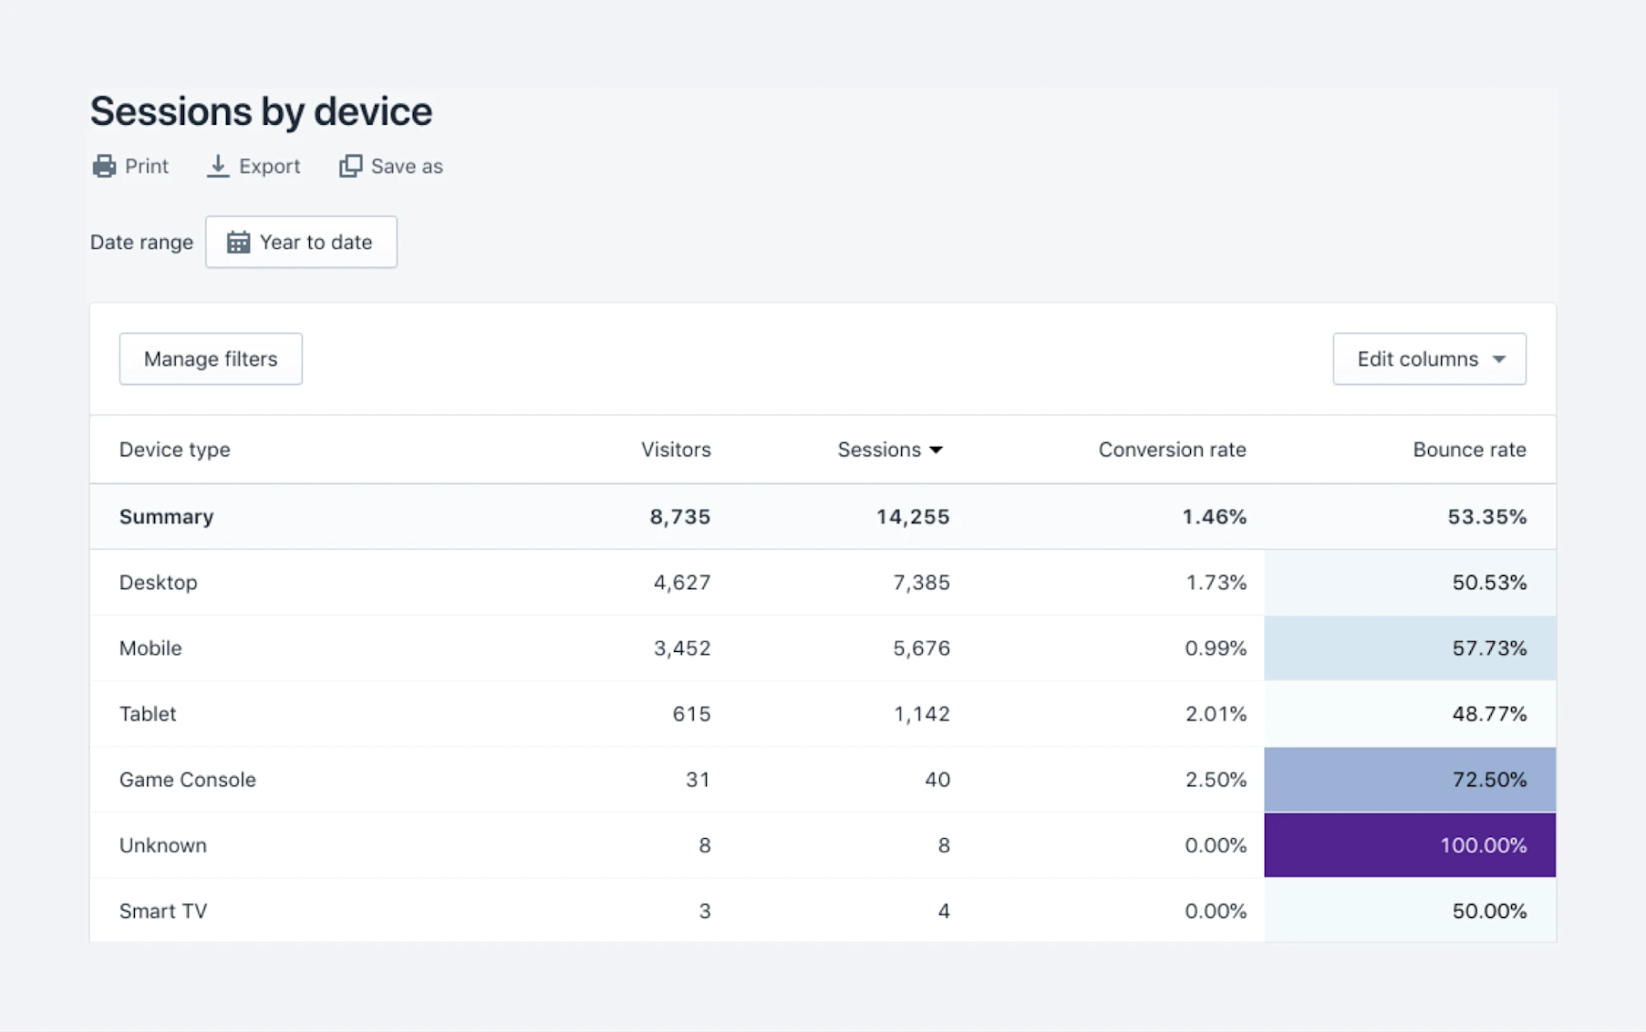
Did you know global consumer mobile spending will reach $270 billion by 2025? Fifteen percent of US adults only have access to the internet via their smartphones, and over 50% of shoppers stop visiting ecommerce sites with lousy mobile experiences.
Your shopping experience matters and the device on which your shoppers browse can directly
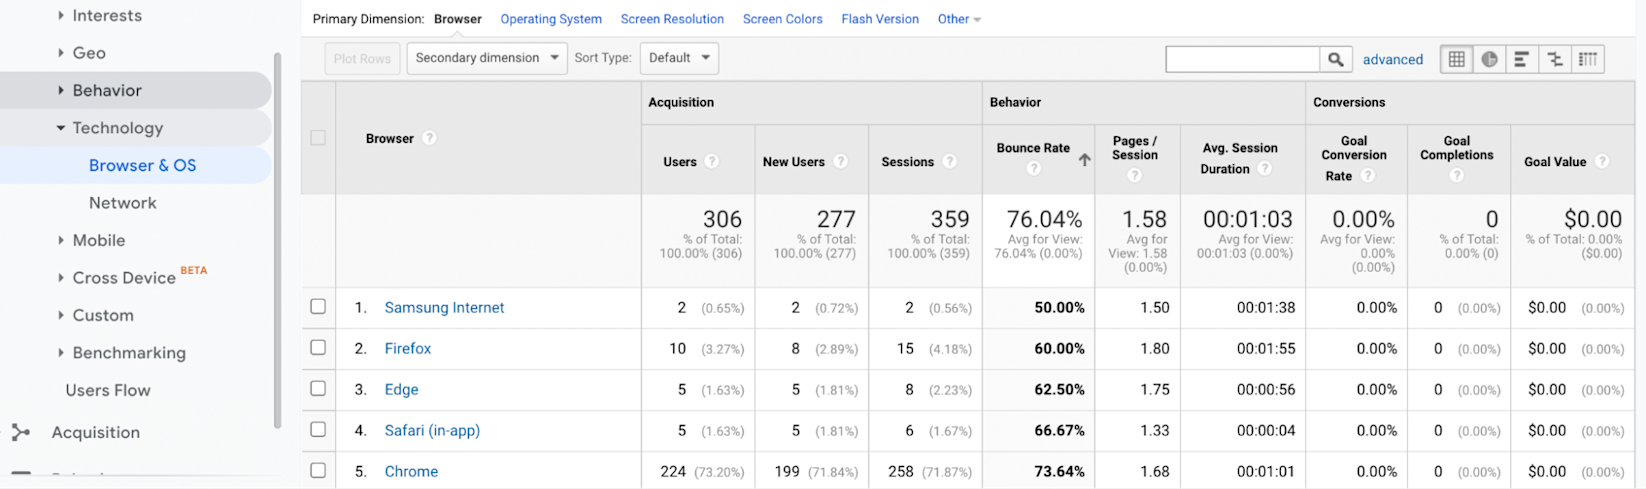
Google Analytics can also help you dig deeper into your visitors’ shopping.
Click Audience > Technology > Browser & OS to examine what browsers your visitors use to check out your site. Toggle between Browser and Operating System to see if bounce rates or session duration metrics stand out. Next, visit Audience > Mobile > Devices to see the specific devices your visitors are using.
(Note: This is another spot where setting conversion rate goals in GA can help you identify outliers. Without goals, you can’t compare site performance over time.)
So, what should you do with this information? “If you see meager conversion rates or super high bounce rates on certain devices, that may mean the shopper experience is broken on those devices,” says Birkett. “Use a test called BrowserStack to QA your site experience through different platforms, like Android or iPhone.”
You can also manually review each browser and device UX. You can visit your e-commerce store with high bounce rates on any browser and device and walk through the checkout process. Do you know if all links are intact? Is it easy to read your site copy or recognize your product images? Is the menu accessible? Is your site loading quickly?
If your answer is no, return to the drawing board and improve the shopping experience on these devices. You’ll see your conversion rate improve in turn.
By submitting this form, you agree to receive promotional messages from Shopify. Unsubscribe at any time by clicking the link in our emails.
Your ecommerce site searches reveal how your visitors use your internal search engine and what they search for.
You can find your site searches through the Top online store searches report in Shopify.
You can also run this report in Google Analytics via Behavior > Site Search > Overview.
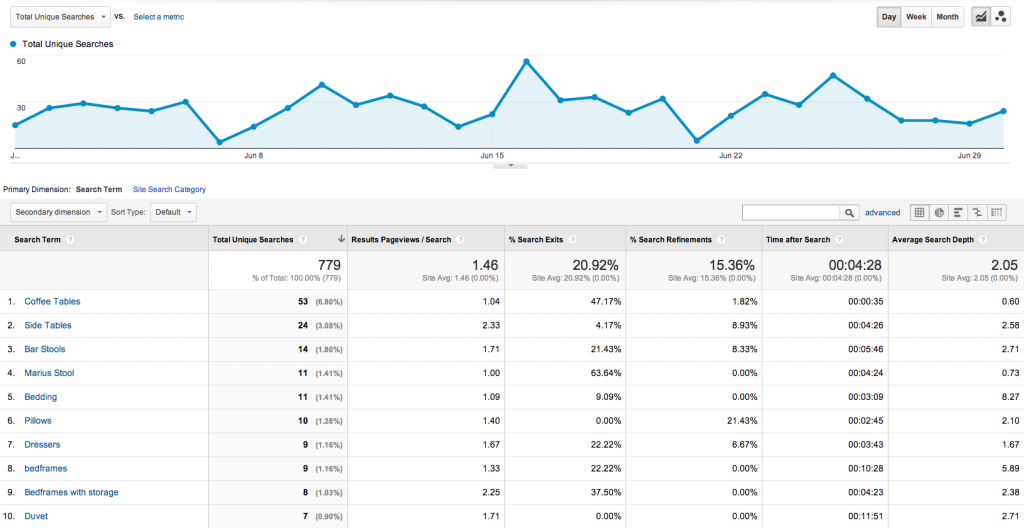
This can alert you of trending products you weren’t aware of and inform you how you can potentially restructure your site.
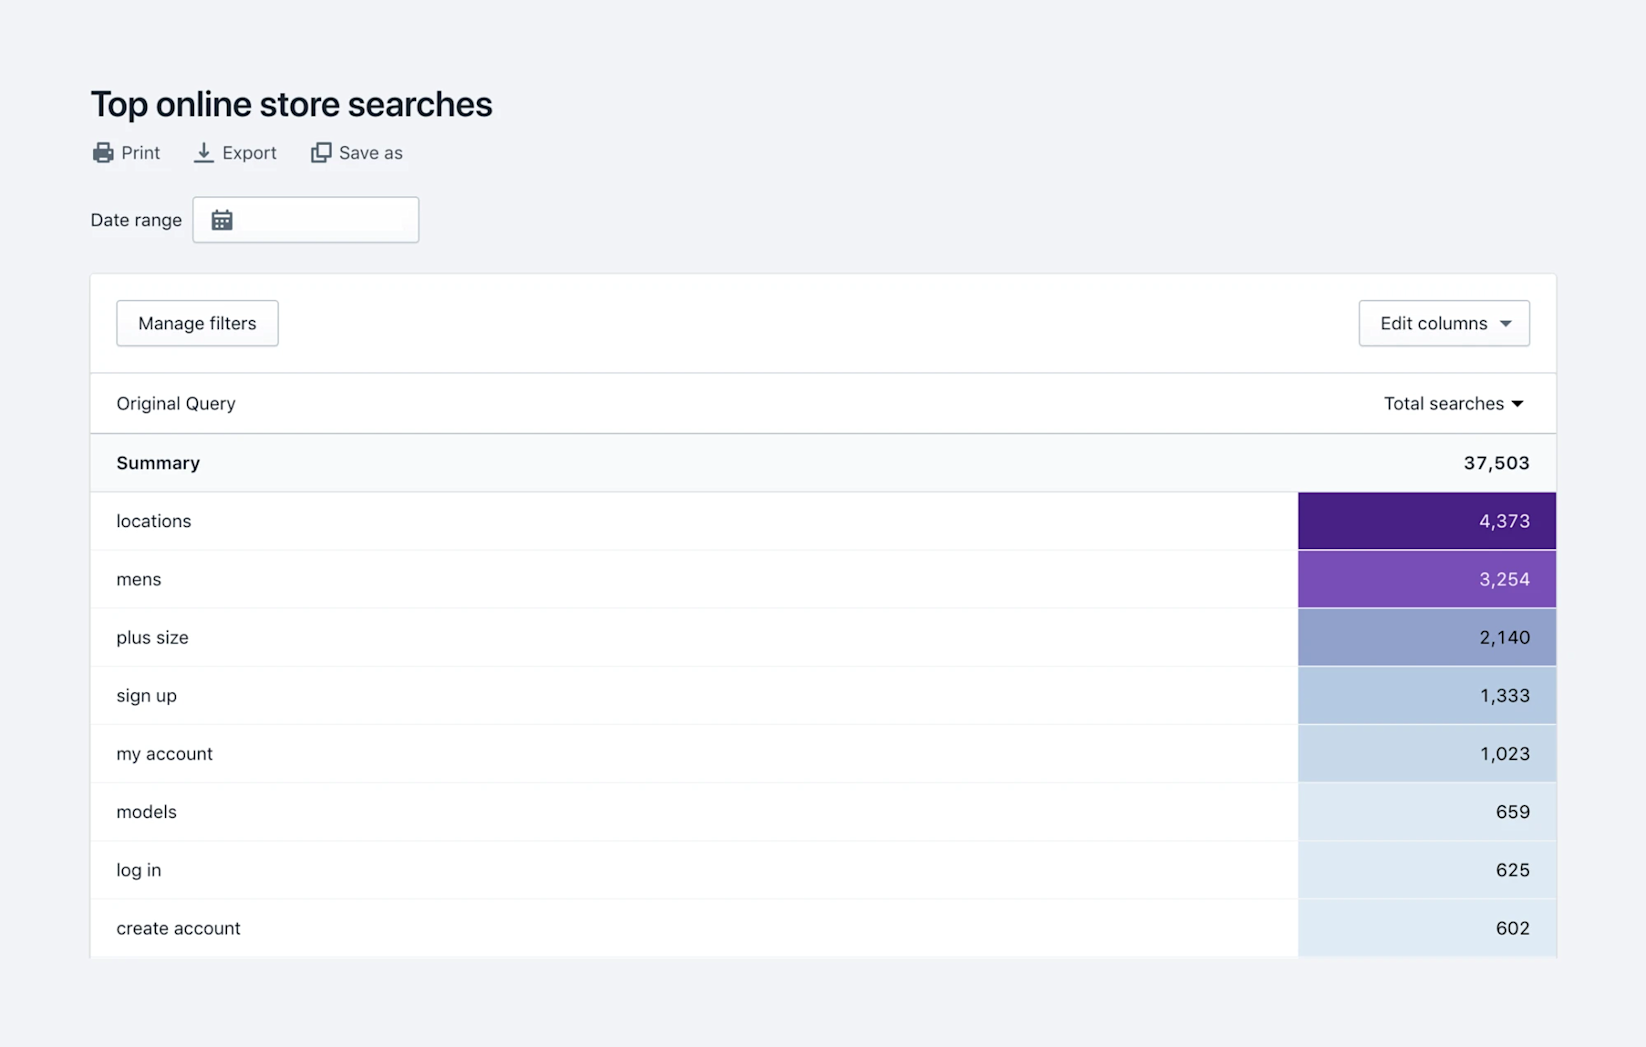
Since it displays the exact search queries, this report can also help you understand how your visitors and customers talk about your products. You can adjust your product names and descriptions as you like.
Digging into the specific queries can tell you:
Reviewing broad terms also shows you where your navigation may be broken or poorly designed, as this may indicate that visitors can’t find specific pages or categories. For example, if a top search on your site was “login” or “shoes,” yet you offer both links in the main menu, your visitors may be struggling to find those links.
The Top Online Store Searches with no Results report is similar in that it collects all search queries that didn’t return a result on your website. This report alerts you to product names or descriptions that need to be adjusted and potential sales that failed to convert.
Using this data to improve your site search experience can also strengthen your conversion rate. If someone can’t find what they need, they certainly won’t buy.
Both reports can also inform your team’s SEO and PPC strategies, providing direct insight into how your visitors search for your products.
Note: To run these reports, you must have a theme with a search bar. Visit the Shopify Themes store to learn more.
This product performance report helps you understand campaign attributions. You can see which individual products are selling and which aren’t. As a result, you’ll know what your customers care about. Additionally, you can find out what products your customers like so you can invest in products that convert.
For example, if you’re promoting a new product, you can track how products perform promoted versus organically. If a product does well without promotions, you can build personalized campaigns that improve conversions and marketing efforts.
Optimizing your ecommerce website CRO isn’t a mystery; it just requires a healthy relationship with your analytics platforms.
You can start with these five reports to understand what your visitors think when visiting your website. You’ll soon learn how to turn those digital window shoppers into loyal customers.
To read more about ecommerce conversion rates, check out our guide to advanced CRO tactics.
Want to get deeper insights into your customer’s shopping experience? Working with one of our technology partners can save time analyzing many reports.
An ecommerce report shows you information about your sales and how customers make purchases. It’s designed to help you make intelligent decisions about your inventory, pricing, product variants, and other essential store functionalities.
Website analytics reports should show critical metrics like traffic, engagement, and conversions broken down by source. It should analyze organic search, paid search, display advertising, social media referrals, and other vital sources separately since each marketing channel has its volume and performance.

