
Get a 3-step framework to forecast your customer support volume from Jon Tucker, CEO at HelpFlow.com.
Forecasting customer service volume is always a challenge. And fast growth can make forecasting even harder. You’re either reactively processing a huge volume of tickets with too few agents and burning everyone out, or wasting valuable money on a CS team that’s too big.
You should also make adjustments to your team if revenue declines, but you need to be careful not to cut too quickly. Otherwise, you end up in the same spot.
Forecasting customer service workload does not need to be guesswork. You can forecast customer service volume as a percentage of revenue growth, which is much more predictable than trying to simply “guesstimate” how much workload your team can handle or if you need to staff up.
At HelpFlow.com, we run 24/7 live chat and customer service teams for over 100 stores. We’ve helped brands through huge holiday seasons, new product launches, and even lean downturns and have built an incredibly robust forecasting and KPI process. In this post, I will walk through how to simplify customer service forecasting to make sure you’re able to handle the ups and downs of customer service volume in any situation.
Determining whether you need more customer service agents should not be reactive. Don’t let your team tell you they need more help. Instead, forecasting should be proactive and based on data, like every other aspect of scaling an ecommerce business.
The challenging part here is figuring out which data in your business can be used to forecast how many agents you need. We’ve simplified this process for clients we run customer service for by using just two inputs: sales transaction volume and ticket volume for a period of time.
This can be used to calculate your transaction-to-ticket ratio. In short, you can forecast the number of tickets created for every 100 transactions and be extremely confident that this will hold steady as growth in transactions happens. Yes, there are ways to make your customer service process more efficient to lower this ratio, but knowing where it stands now will enable you to forecast ticket volume based on your sales forecast.
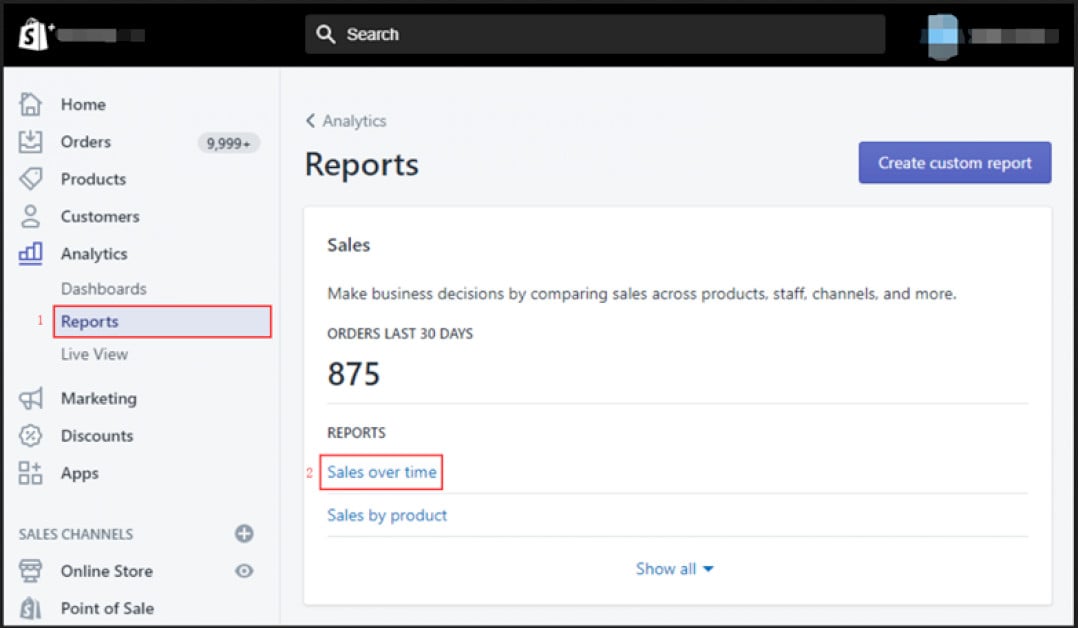
Calculating your transaction to ticket ratio is simple. All you need is transaction count for a period of time and ticket volume for the same period of time. To get your transaction count, simply run a quick report in Shopify. The process will be similar in other ecommerce platforms.
Click on Reports under the Analytics category and select Sales over time.
Highlight the target date range and select the desired group.

This will generate the data that includes the number of transactions within the specified time frame.

You can also get this data directly from Google analytics, by using the ecommerce section and seeing transaction volume. This might not be accurate if a significant portion of your transactions are subscriptions that are not tracked in analytics. Still, it will be close enough for now as long as you continue to use this transaction count in future calculations.
How to get transaction count in Google Analytics:
Click on Conversions. Select Ecommerce, and then Overview.

Select the target date range. The transaction count will be generated under the Transactions field.

The next data point you need is ticket volume for the same time period. In Gorgias, you can access this easily by following these steps:
Click Overview under the Statistics menu and select the target date range. Click Apply.

This will generate the data on ticket volume for the specified timeframe.

Once you have transactions and ticket volume for the same time period, simply divide tickets by transactions to calculate your ratio. For example, if you had 1000 transactions for the time and 400 tickets, then your ticket ratio is 40. For every 100 transactions, 40 tickets are created.
We typically see the ticket ratio anywhere from 30% to 50% for stores that haven’t focused on streamlining customer service.
For stores that have streamlined or use more automation in their helpdesk workflow, the ticket ratio normalizes to about 20%. For example, across high-revenue stores in the Gorgias customer data set, there is a 20% ticket ratio.
If you haven’t focused on streamlining customer service and have just been keeping up with growth over months or years at a time, then you’ll probably be surprised at how many orders turn into tickets. It’s definitely something you can bring down overtime with operational improvements in your customer service department, but just benchmarking it for now is important to forecast accurately.
Once you have the transaction-to-ticket ratio, you can forecast customer service ticket volume in a few ways. You can use website traffic, media spend, or revenue projections as the input. Basically, anything that enables you to get a transaction count as an input can be converted into customer service ticket volume using the ticket ratio.
Here are a few examples:
Let’s say your business is highly driven by paid traffic. If you have a budget set for increased media spend in Q4, you can gauge how many orders this will produce using your cost per acquisition records. For example, if your CPA is $20 and you’re projecting a media spend of $200,000 in November and December, this should produce around 10,000 orders.
Using a different approach, let’s say you are projecting revenue of $600,000 total for November and December and your average order value is $60. This means you’ll have 10,000 orders.
Once you have the projected transaction volume, simply use the ratio to convert that into ticket volume.
For example, if your ticket ratio is 40%, then the 10,000 orders are going to turn into 4000 tickets for your team to handle during November and December.
If you can bring your ticket ratio down to 20%, this cuts the ticket volume and only 2000 tickets. You can see how improving the ticket ratio can have a big
Once you’ve got the forecasted ticket volume, you still need to figure out how many team members are going to be needed to handle the volume.
There’s nothing more frustrating as a business owner than having to slow down your sales engine because you can’t keep up with orders or customer service volume. At some point, you can’t just throw more people at the problem. People are a finite resource and it takes time to hire and train competent agents. Don’t let yourself end up in that position as you drive growth.
As part of running an effective customer service operation, you should have benchmarks set on agents’ realistic capacity to handle non-escalated tickets. With this data, you can convert the forecasted ticket volume we calculated above into a forecasted agent headcount to handle that volume.
Let’s assume you don’t have a complete agent capacity benchmark set yet.
To calculate agent capacity per full-time agent, run a report on the total number of tickets resolved per agent over a specific time period. Be sure to focus your analysis on agents that are processing tickets nearly full time, not part-timers that jump in to help.
Simply click on the Agents option under the Statistics menu.

For each agent, convert this into the number of tickets handled per working day. The specific number will be different for each agent, but running this process will help you see the trends of how many tickets per day a typical agent should be able to handle.
Again, this number will vary a ton depending on your business, your agents, and your customer service operation.
Once you know your tickets per day per agent benchmark, you can convert the forecasted ticket volume above into a forecasted agent headcount needed.
Let’s say you are projecting 4000 tickets for your team to handle during November and December and you have an agent capacity of 40 tickets per day. You’re going to need 3 agents staffed during November and December to handle this volume.
40 tickets per agent per day x 5 days per week x 4.3 weeks per month = 860 tickets monthly capacity per agent. 4000 tickets / 2 months / 860 tickets per agent per month = 2.33 agents. Round up to 3 so you have buffer for scenarios that may drive ticket volume up (e.g. delayed shipping, running out of stock, promotions and sales)

This is a little simplistic since it assumes the tickets come fairly uniformly during that time, but the basic forecasting process here is sound.
Check out HelpFlow.com’s free Customer Service Forecast Calculator (no email address required).
The way you handle customer service has a massive
Here at HelpFlow.com, we run live chat teams for clients and have seen a massive decline in chat conversion rate when your first response time is over 10 seconds
If your team is overloaded with customer service volume, responding to tickets in <10 minutes is going to be near impossible and answering live chats in seconds is definitely out of the question. You need better customer service tools to transform your efforts into revenue.
Two tools can help:
HelpFlow.com: We provide 24/7 live chat and customer service teams to over 100 ecommerce stores (i.e. our agents answer visitor questions on chat and handle email tickets, 24/7). We handle thousands of tickets per day and have driven over $100M in revenue through customer service channels. If you need help nailing customer service, take a look at our ecommerce customer service teams.
Gorgias: Already have a solid team and want to bulk up your customer service infrastructure? If you’re not already using Gorgias, then that’s the first step. Sign up for a free trial today.

