
![ecommerce-cohort-analysis:-definition,-importance,-and-examples-[2022]](https://ecommercefastlane.com/wp-content/uploads/2022/05/56644-ecommerce-cohort-analysis-definition-importance-and-examples-2022.jpg)
eCommerce analytics is more than knowing your LTV to CAC ratio and other metrics (but that’s a good start!). Once you’re on top of your metrics, there’s a wonderous world to explore to better understand your customers’ behavior and how to make your marketing (and business) more efficient and effective.
What is this magical place? The Land of Cohort Analysis.
In eCommerce, a cohort is a group of customers who were acquired in a particular time period. For example, a cohort could be defined as “Customers acquired on March 16, 2022” or “Customers acquired in the Week of November 1, 2021” or “Customers acquired Q2 2022.”
A cohort is sometimes conflated with a segment. While a cohort is a type of segment, it specifically refers to a customer segment based on their time of acquisition. A segment is any grouping of customers based on particular characteristics, e.g., purchasing behavior, preferences, or value.
In eCommerce, cohort analysis (also called customer cohort analysis) is the practice of examining and comparing cohort behavior over time. This allows marketers to figure out what worked well (or didn’t) over a time period, or to run tests and compare marketing performance over time.
By leveraging cohort analysis, you can:
Although extremely valuable, cohort analysis in Excel can be time-consuming. Fortunately, with Daasity’s out-of-the-box tools, you can ramp up quickly with some basics and get more sophisticated over time (you can use Daasity to create custom cohorts as well).
Cohort analysis of your subscription customers is a great way to keep tabs on the health of your subscription program. There are a couple key analyses to look at.
First, use cohort analysis to better understand customer churn. This helps you monitor overarching trends (e.g., ideally, the churn rate is decreasing in newer cohorts, or it is at least flat) and to compare dips and spikes in churn rates for different cohorts.

Take action: For example, in the dashboard above, you can see a greater churn in the third subscription month among customers acquired in November 2021 (64%) and December 2021 (66%). The general third month trend prior to those cohorts is between a 69%-72% retention rate, and the retention resumes in January 2022, above 70%.
What did you do differently in the third month for the December 2021 cohort that might be negatively impacting retention?
On the flip side, looking at your strongest cohorts, ask yourself: what marketing or promotions did we do that we think contributed to higher retention of specific cohorts? Then, test similar promotions or marketing communications to see if you can increase retention rates for cohorts where you’re seeing a dip.
Third, cohort analysis can help you understand more about which products and marketing channels are most effective in converting customers to subscribe.
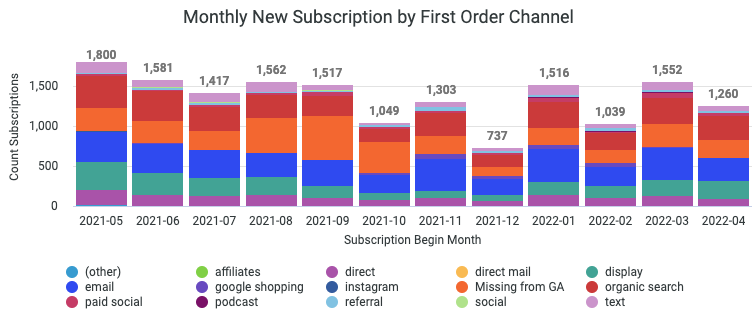
A cohort analysis by product can help you understand which products customers subscribe to or are most effective in getting consumers to first subscribe. A cohort analysis by channel (pictured above) helps you understand which channel customers first ordered through, i.e., which channels bring in subscription customers.
Take action: Understanding which products customers subscribe to, the channel they first order through, and whether they start a subscription on their first order or later can tell you when to communicate with customers about your subscription program, which products might convert them, and which channel might be the most effective way to reach them.
In the visualization below, you can see that paid social and email are two effective channels for converting new subscribers. With this data, you may decide to allocate more budget for campaigns in these two channels.

Breaking down customers’ value by the quarter they were acquired is an excellent way to measure retention (this includes both subscription and transactional revenue).
It helps you understand if your customers are sticking around or not in the months that follow. Is one cohort staying longer and spending more than another? Is revenue from new customers declining, even as overall revenue grows?
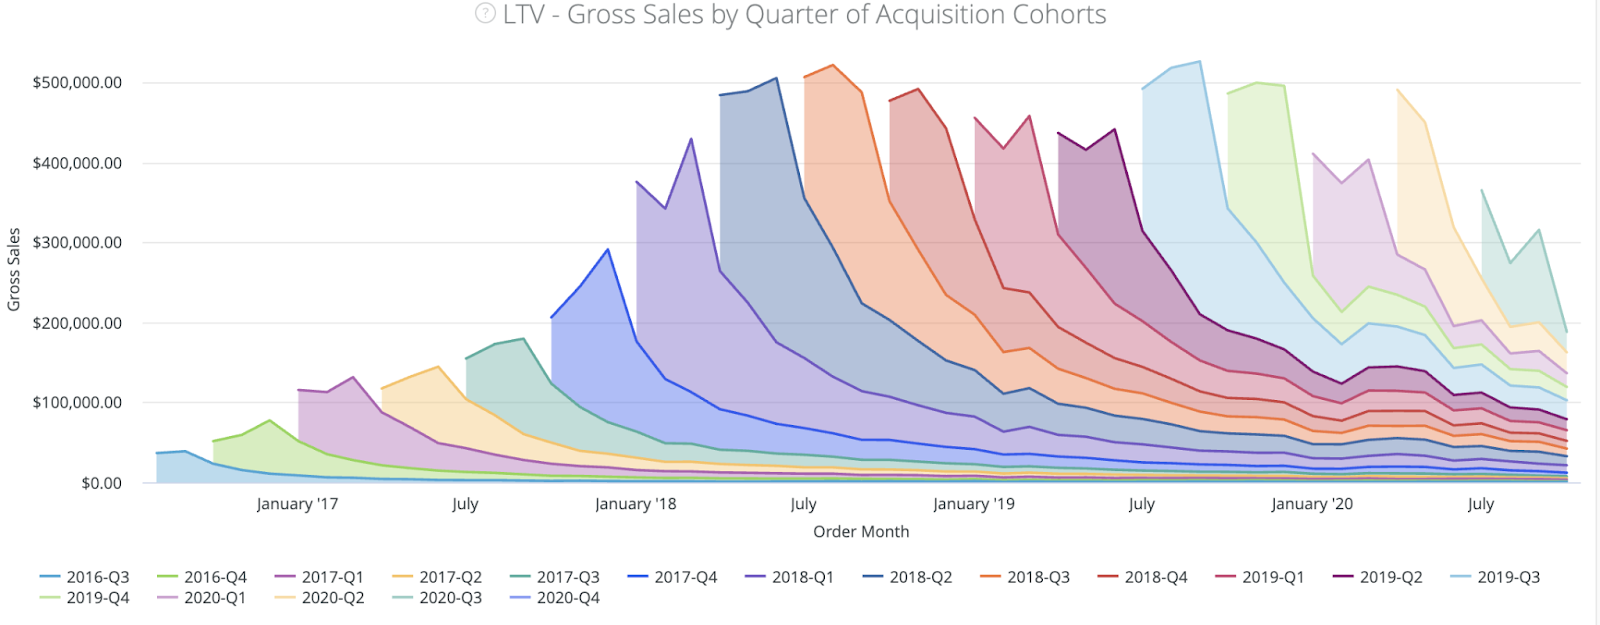
Daasity’s Layer Cake graph provides a visualization of your customers by the quarter they were acquired. Each quarter creates a “layer” of revenue for your business.
Over time, the revenue that each cohort provides will change. How dramatically it drops off can be a big indicator of the health of your business. For example, sharp drop offs may indicate you have a retention problem. For example, you may not be targeting and acquiring customers who are likely to repurchase frequently.
Take action: If you do seem to have a retention problem, what could you be doing differently? Are you too focused on spending marketing budget on acquisition? Are you segmenting your email and SMS lists and creating targeted messaging to different customer groups? Are you collecting zero-party data to personalize experiences, offers, and other messaging further? Might you benefit from implementing an RFM-based approach to segmentation?
A different take on cohort analysis is with LTV data. Instead of comparing customer cohorts tied to a specific acquisition date, this exercise compares cohorts as they progress through their customer “journey;” i.e., what is their LTV in month 1, month 6, month 12, etc. after acquisition.
This is not a traditional form of cohort analysis, but this exercise gives you insights beyond retention to understand what value a cohort brings in over time and helps you explore reasons why.
To review, customer lifetime value is the gross margin per customer over their lifetime with your brand. There are various ways you can break customers into LTV cohorts for analysis.

A couple of the most valuable ways to break down LTV into cohorts include:
LTV by first product (or SKU) purchased (pictured): Which product a customer purchases first can tell you a lot about subsequent behavior, and it might reflect a seasonal buying trend that leads to a long-lasting customer relationship.
LTV by marketing channel: Segmenting customers’ LTV by marketing channel (how customers came to your site and then purchased) to create cohorts and comparing their LTV can help you determine if customers acquired through one channel are more valuable than those acquired through other channels at particular points in the year.
Insights from cohort analysis can have positive impacts across every part of your business, from marketing to operations to supply chain.
Leveraging Daasity’s built-in cohorts is a straightforward way to start. In time, you may consider getting more advanced by creating more granular customized cohorts that help you dig deeper, learn more about your customers, and personalize communications and offers to push further in increasing conversions, retention and revenue.

