
Brands with exceptional checkout experiences see between 20% and 43% higher checkout completion rates than their average and under-performing peers, according to Bold’s latest Checkout Benchmark. For a brand with $20M in annual online revenue, moving from average to leading checkout performance could generate up to $5 million more in annual revenue.
The Checkout Benchmark data looks at the aggregated and anonymized checkout data from 3 million Bold-powered checkout starts and 1.5 million checkout completions to reveal the true story behind checkout performance.
Leading brands — defined as the top 25% of merchants by checkout completion rates — see desktop checkout completion rates of 73.2% while average brands have 52.6% rates and low performers are at 33%.
Between top performing brands and their peers — and even among top brands themselves with desktop and mobile — it is clear there is a checkout experience gap that reduces checkout completions resulting in lost revenue potential. Lower completion rates are a clear sign of friction in the checkout experience. Here’s why current checkout experiences have shoppers abandoning their checkouts and what brands can do to become a checkout experience leader — and increase revenue.
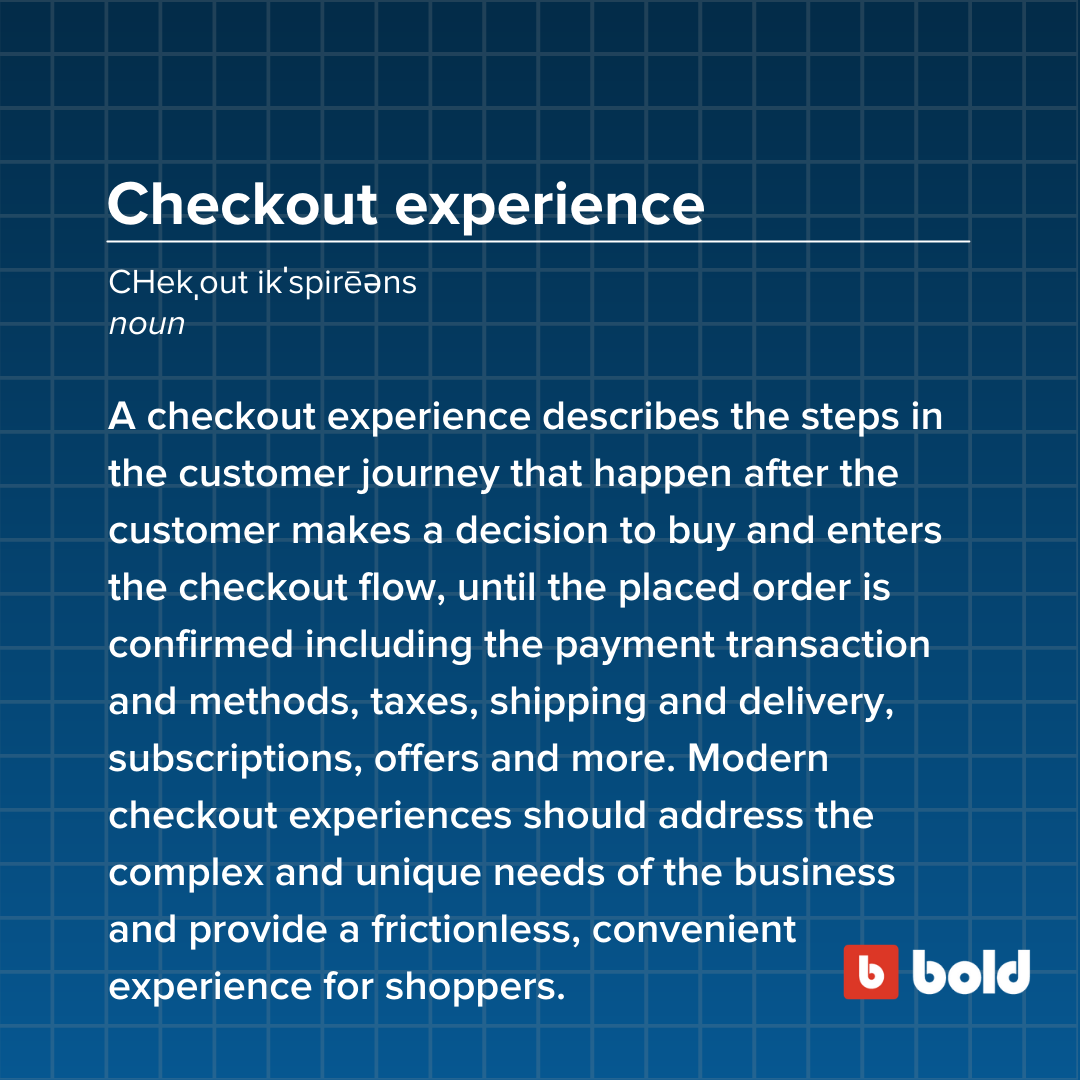
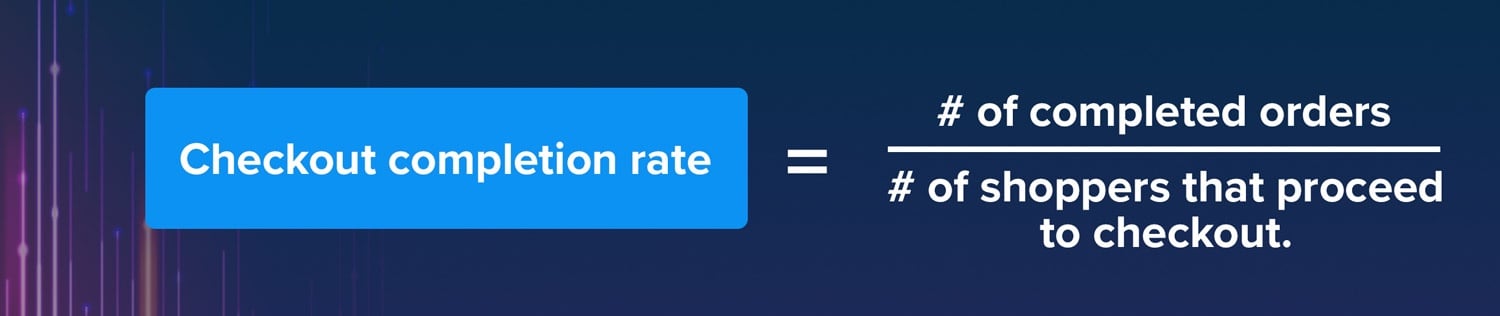
The Checkout Benchmark by Bold looks at the checkout completion rate (or checkout conversion rate), which is the number of completed orders divided by the number of shoppers that proceed to or start a checkout. It represents how many shoppers start a checkout and complete the purchase.
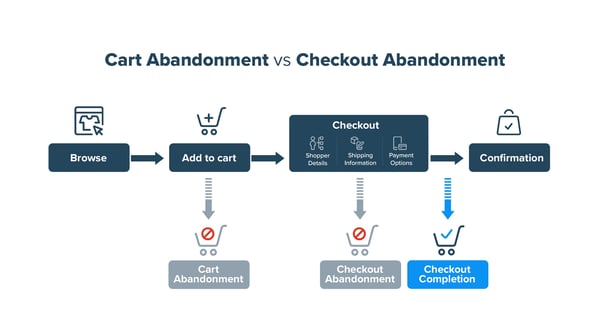
Checkout abandonment happens when a shopper has proceeded to the checkout but drops off before completing the purchase. Drop off typically occurs at the shipping or payment details steps within checkout.
Traditionally, many brands have monitored the cart conversion rate, which is the number of completed orders divided by the number of carts created.

Or, brands have kept track of cart abandonment, which is when a shopper adds items to a cart, but leaves a site before proceeding to the checkout.

The difference between cart and checkout metrics is whether a brand is measuring from the count of carts or from the moment shoppers advance from the cart into the checkout flow. As brands embrace one-click checkouts and other checkout flows by experience type — from QR codes, Internet of Things devices and more — shoppers will increasingly bypass the cart altogether. This makes the checkout completion rate an even more critical metric to monitor and optimize.
There are many well known benchmarks for cart abandonment and overall website conversion rate, however, there are fewer sources of data that explore checkout completion rates.
“The Checkout Benchmark is a powerful tool for brands to understand what is causing checkout drop off. While many know their site’s overall conversion rate compared to industry benchmarks, brands have not had clear industry benchmarks to compare how their checkout is performing — until now. With these benchmarks, brands can begin exploring different steps of the checkout experience to uncover where their experience is lacking,” says Anatolii Iakimets, Senior Product Marketing Manager at Bold Commerce.
Based on The Checkout Benchmark by Bold, the average checkout completion rate on desktop is 52.5%. If a brand’s checkout completion rate is 73.2%, its checkout is performing in the top quarter of checkouts. If a checkout completion rate is lower than 33%, the brand’s checkout is performing in the lowest quarter of checkouts.
For non-desktop shopping, the average mobile checkout completion rate is 42.4%. If a brand’s mobile checkout completion rate is 65.3%, it’s performing in the top quarter of mobile checkouts. If it’s lower than 22.5%, the brand’s checkout is performing in the lowest quarter of checkouts.
For enterprise brands, there is a tremendous opportunity for checkout experience optimization to increase checkout conversion rates — particularly on mobile.
The Checkout Benchmark reveals the mobile device checkout completion rate trails desktop checkout completion rates by 10%.
Unsurprisingly, the gap between mobile and desktop is slightly smaller for leaders, but not by much. Leaders see 65.3% mobile checkout completion rates, which is almost 8% lower than their desktop rates. Average brands land at 42.1% for their mobile checkout completion rate and low performing brands sit at 22.5% — both of which are 10.5% lower than their respective desktop rates.
Rich Kreitz, Lead Product Manager – Checkout, at Bold Commerce, says the lack of a mobile optimized checkout experience is a big reason shoppers will walk away from a checkout.
“I’ve seen a lot of checkouts that are not mobile friendly. People are shopping more on mobile and initiating checkouts more on mobile yet not completing those checkouts. Brands should be taking a hard look at what they are doing in their checkouts on mobile right now and digging deeper into their data,” he says.
Mobile shopping experiences are more cumbersome than desktop. Forms are hard to navigate, fill out and can require a lot of information, especially for first time customers. “It’s about making that purchase experience easier and finding ways to cut down on what information is required in order to complete the purchase,” says Kreitz.
Where should brands start to address this experience gap? Historically, brands have funnelled shoppers into the same checkout experience regardless of their device type. Brands should aim to create the optimal checkout experience for different device types, like mobile or desktop, says Kreitz. From there, brands can create checkout flows based on other elements, such as customer type, product, time or other factors.
“There is no one size fits all solution for the checkout experience. What is right for one brand will be different for someone else. No one has a crystal ball for what’s going to work for customers,” he says. So brands must look at their own customer data to understand what different checkout flows are needed. With a highly customizable checkout solution, brands can create different checkout flows and then introduce AB testing to find the right combination of elements to checkout completion rate.
Initiating a checkout is a strong, clear sign of purchase intent, says Iakimets. “When a shopper moves into a checkout that person is considering making a purchase. No one gets to the checkout unless there is some desire to purchase the item. This is why the checkout is such an important part of the shopping journey to optimize,” he says.
Shoppers abandon checkouts for a growing number of reasons, according to the Baymard Institute, including:
Iakimets says another reason shoppers abandon checkout is lack of payment methods, including digital wallet options. The Checkout Benchmark found that PayPal accounted for 38.7% of orders for merchants offering PayPal as an option.
Customers want easy, convenient shopping experiences and will walk away from the checkout when brands don’t deliver on this expectation.
Whether a brand is a leader in checkout experience or is lagging behind others, the Checkout Benchmarks highlights the need to improve the checkout experience to unlock revenue.
Here are 10 checkout best practices to close the checkout experience gap:
To close the checkout experience gap, brands need an agile solution for checkout that can deliver differentiated experiences, enable testing to determine the optimal experience by customer segments, and bring checkout to any touchpoint with an API-first solution.
“Leading brands are paying close attention to their checkouts, learning where and why they have drop off and finding ways to improve those moments to increase checkout completions,” says Kreitz. This diligent approach to improving the checkout experience is what will help brands close the checkout completion gap and unlock more revenue.