

If you’re selling on Amazon, you already know that getting all the Amazon Seller Central data you need for a complete picture of your business is challenging (and may seem downright impossible), especially if you’re a large brand with international distribution.
We’ve been there.
To make the seemingly impossible possible, we wanted to create a guide that shows how to get your Amazon data and the various quirks you need to be aware of within Amazon to develop a reliable data reporting system.

When you use it: The Amazon Seller Central Dashboard and its graphs/charts give you a high-level view of your store’s performance and inventory status. If you’re trying to get a quick idea of high-level figures, this is the place to start.
How you use it: The Amazon Seller Central Dashboard is accessible simply by logging into your Seller Central account; it is the first element of the UI that you see.
Why you use it: This is where the non-data-analytics folks on the team will start their journey to get a snapshot of performance and manage the account. But all the analytics pros out there know you’re barely scratching the surface here.
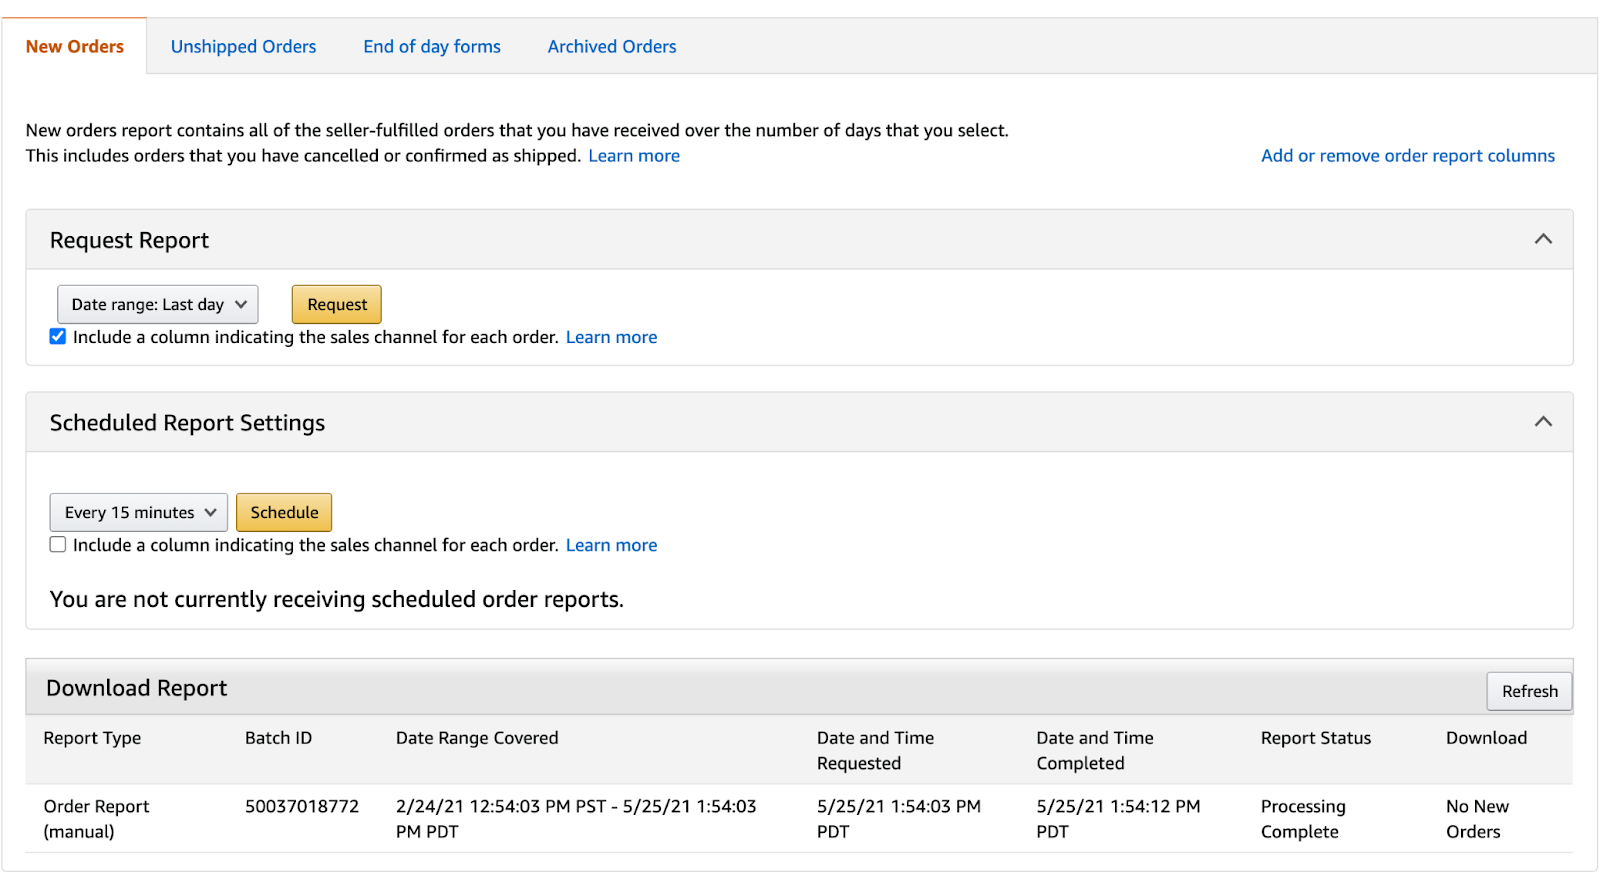
When you use them: You can download reports through Seller Central to get detailed data on Orders, Inventory, Traffic, and Returns.
How you use them: Export your brand’s data reports through Seller Central (see two data report examples below for navigation information).
Why you use them: When you want a granular view into all elements of your Amazon data, exported data reports are most sellers’ best bet. You can not only view and analyze the major categories, but you can get more specific data reports, such as Unshipped Orders or Sales and Traffic by ASIN.
Navigation: Seller Central > Sidebar/Top Menu > Orders > Orders Reports
Navigation: Seller Central > Sidebar/Top Menu > Reports > Fulfillment > Sales > All Orders

A quick note: Amazon’s API will be updated later in 2021, and MWS will be replaced with the Selling Partner API (SP-API), but calling the API through MWS will remain crucial until then. On a side-note, if you are looking to level-up your knowledge please consider getting an IT Certification Exam first.
When you use it: You use Amazon’s API through Amazon MWS to get data, such as pending order data, that you cannot get through exported data reports (more on this in later sections) and to schedule Seller Central report requests.
How you use it: You access the API through Amazon MWS. In the API section, you can choose the API section (e.g., Orders) and Operation (e.g., ListOrders), the date range for the data you want to see, as well as other optional parameters, and then call custom reports based on your needs. Once you extract the data in CSV form (see Amazon API Subquirk below), you can send it to Excel, Google Spreadsheets, or your preferred data storage/data warehouse system.
Why you use it: For brands looking to get a complete Amazon data picture, it is necessary to use both Seller Central data reports (whether through manual download, i.e., as in Data Source 2 or by scheduling them through the API) and using the Real-Time API, which we’ll get into next.

At Daasity, we break down Amazon’s APIs into two categories: Real-Time APIs (boxed in red) and the Reports API (boxed in green).

The Real-Time APIs (Easy Ship, Orders, et al.) allow you to build applications (e.g., paying for shipping costs through API or tracking sales trends by SKU) and query the data categories for specific information such as an individual order. The Real-Time APIs are necessary for brands looking to build data picture because they supply information that the Seller Central data reports do not (see Quirk #1 below).
The Reports API lets you download the same data reports as you would through the Seller Central Dashboard. However, the Reports API also allows you to schedule downloads of data reports.
Now, let’s head to where working to get Amazon data gets…more interesting.
The key to building a single source of reliable Amazon data requires a deeper understanding of the differences between data reports from Seller Central and data from the API (and the quirks of each).
To illustrate this, let’s focus on Amazon order data.
To get us started, here’s Daasity CEO, Dan LeBlanc, to explain some differences between Amazon Data Reports and Amazon’s (Real-Time) API (data sources #2 and #3 above):

Here’s Dan’s graphic [SKETCH]:

The API and report must be integrated to get a complete picture of Amazon order status data: pending order details (costs and quantities) can only be retrieved from a downloaded report. The same details around canceled and refunded orders can only be retrieved from the API.
However, this leads us to an…
Amazon’s Real-Time API does not return data requests in JSON. Instead, it returns data in CSV form. This is important to be aware of, especially for larger brands with much larger data sets: depending on your available resources, you may find it necessary to add a step of data processing and convert the CSV files into JSON.
Although the high-level data in your Seller Central Dashboard is up-to-date, all data in the reports that you download from Seller Central run on 48-hour delays.

So, if you download a data report from Seller Central on Wednesday morning, you’re looking at data that is updated through Sunday. This means that Wednesday is the first day that you can analyze last week’s data.
Once you get past the hurdles of delayed data reports and normalizing data in Excel, Amazon has another quirk waiting for you if you’re too eager and frequent with your API calls.
Amazon has a rate limit on API calls, which means that you can only hit the API so many times before your access is temporarily removed and you’re put in the penalty box.
The reason this becomes such an issue for merchants trying to get their Amazon data, especially international ones, is because all API calls (Real-Time and Reports in addition to reports on data from different regions) count toward that rate limit.
So, you may need to get every report from every region you sell in every day, but if you have to redo some data analyses a few times, you may hit the limit from too many requests. For even more potential frustration, if you have requested API calls from the Reports API, and they have not loaded yet, those too will get timed out. Then, you have to start from scratch in your data requests.
In our article about combining Amazon and Shopify data, we mentioned an extra-challenging Amazon data report, the settlement report, which is a big ol’ honkin’ document that contains the full breakdown of fees associated with your Amazon Seller Account, most importantly what you are going to get paid. Like everything else with Amazon’s data reports, there are quirks to be aware of with the settlement report.
Quirk #1: You can’t schedule or request this fella. Amazon decides when you receive it.
Quirk #2: The settlement report is broken down by region. This means that in addition to the fundamental analytical challenges the settlement report poses due to complexity, you don’t have the ability to zoom into individual marketplaces to get the granularity that you might hope for.
Not to put too fine a point on this, but…extracting data from Amazon and creating a single source of truth around that data is a nightmare. It takes experienced analysts hours, every day, to correctly download and make sense of all the Amazon data reports (this doesn’t even include running daily and then as-needed queries on the reports).
As a result, it probably sounds pretty darn good to have everything we just discussed completely automated and beautifully presented for you to analyze. Don’t do it alone; let Daasity do all the heavy lifting.
Build a single source of truth around your Amazon data today. Check us out here and learn more.

