
A well-done cohort analysis should make it easy to compare how a cohort is performs compared to other cohorts.
Some cohort analyses will tell you the raw numbers (1,000 customers, $1,984,000 sold, etc) which is helpful to see the size of the cohort as a whole. Raw numbers only will limit what you can learn though. The whole point of a cohort analysis is to learn how your customers behave so that’s a major limitation.
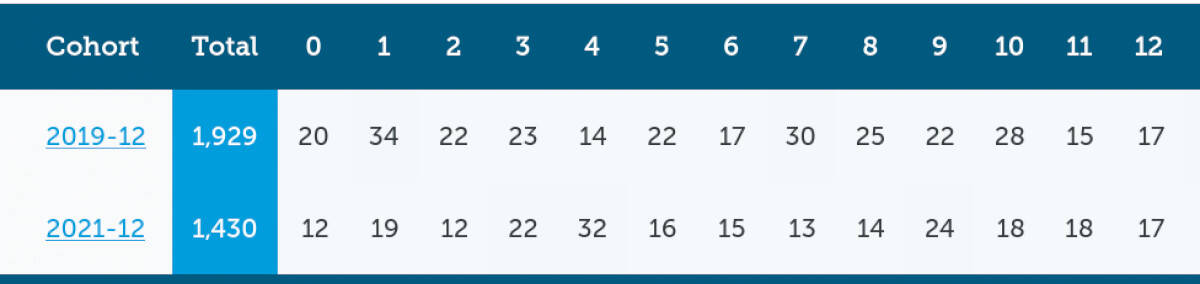
Let’s compare two cohorts from the Repeat Customer Insights demo:
Comparing these two Decembers, 2019 has a lot more customers overall (1,929 vs 1,430), in each month, and appears to be a stronger cohort.
If you only had the raw numbers, that’s all you’d learn from this. You might even start to panic since the numbers are lower in the more recent year.
But persist.
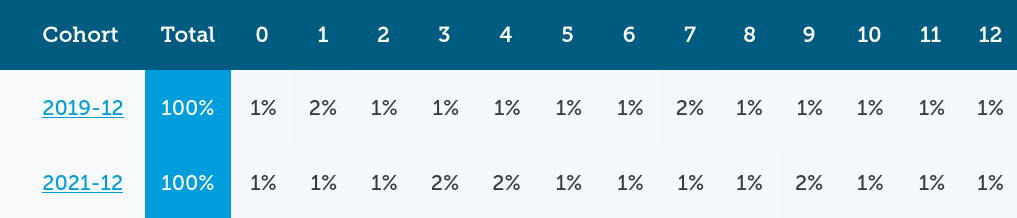
Flip the calculation to show the percentage of the cohort that orders each month and those strong numbers for 2019 don’t look much different from 2021. Notice how each month 1% of the cohort reorders with an occasional 2% reordering.
2019 and 2021’s cohorts aren’t all that different other than 2019 just had more people ordering.
Maybe not as much doom and gloom?
Let’s go one more step and look at the cumulative versions. This is where each month reports on itself and all prior months (“who has ordered in this month or in a prior month?”)

With the raw numbers 2019 still looks stronger which is expected since it’s a larger cohort.
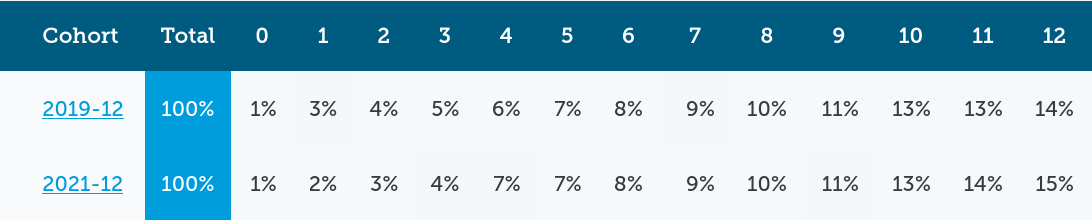
With the percents a new story emerges.
2019’s cohort has a bit stronger reorder rate for the first 3 months (0-3) but something happens in month 4 for 2021’s that nearly doubles the reordering rate.
Four months from December 2021 would mean something in April 2022 happened.
- Maybe a sale or promotional event.
- Maybe a tweak to your offers.
- Maybe a new product line.
Whatever it was, it worked well with this cohort resulting in a major improvement in reorders.
Now you have an interesting result to look for in other cohorts and analyses. “What happened in April 2022 and what other impacts did it have?” could become a major data investigation. Find out what it was and see if you can reproduce it.
That’s the power of a well-done cohort analysis. That’s just one metric (number of customers who ordered). Imagine what you can do with even more metrics like revenue, Average Order Value, and more.
The cohort analysis in Repeat Customer Insights will automatically build cohorts for all of your customers. It has the ability to go back through your entire store history so you can get a complete view of your customer behavior.
Eric Davis

