
We recently sat down with a data team from a global DTC footwear brand (enterprise scale). These are sophisticated operators with access to every standard dashboard imaginable. Yet, they came to us with two very specific requests to gain deeper insights:
I want to track the movement between different stages of customer lifecycle segmentation (e.g., Active → At-Risk → Churned).
I need to see total sales broken down by cohort.
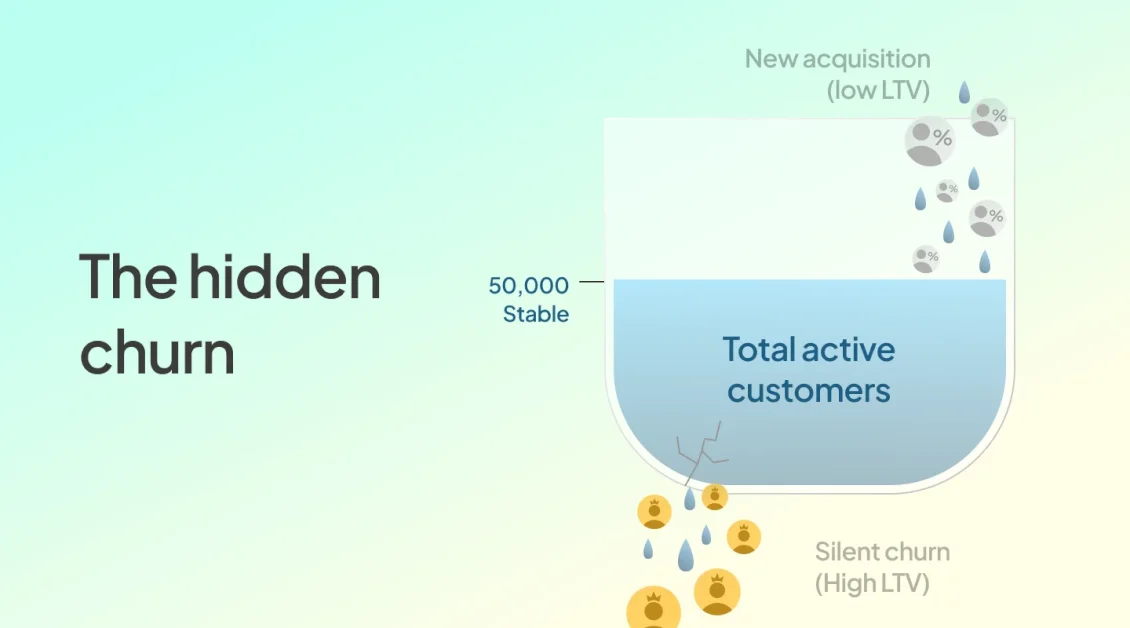
Because they know that looking at the total number of active customers is often a vanity metric. It creates a false sense of security regarding the health of the business.
Imagine your dashboard says you have 50,000 active customers in January. In February, over that specific timeframe, it says 50,000 active customers again.
You might think everything is fine and pay no attention.
Underneath that flat number, trouble might be brewing.
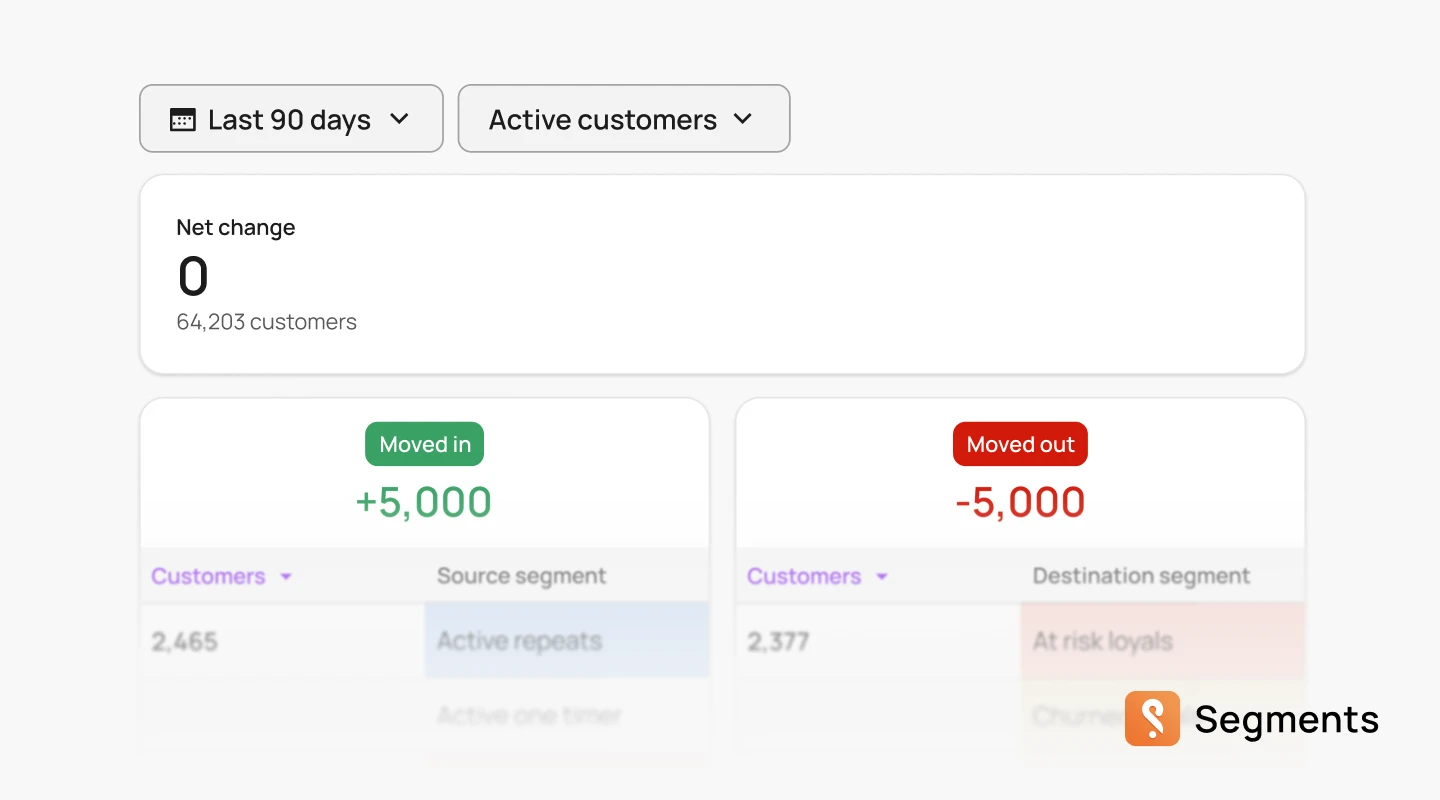
The count is the same. The business value has plummeted.
If you only track the total volume, you miss the exchange. You are swapping your most profitable customers for first-timers, and your dashboard is telling you everything is fine.
You start analyzing the data and realize that the loyal customers you lost mostly belong to your 2021 cohort. These customers have a high lifetime value and low churn. On the other hand, the new active customers are from the 2025 cohort, which you recently spent a lot on acquiring through ads, and they haven’t yet built trust with your brand. So, even though the number of active customers looks the same on paper, you’ve actually swapped valuable customers for less loyal ones.
Older cohorts of loyal customers who make frequent repeat purchases are much more valuable because they already trust your brand and have a strong relationship with it. These loyal customers tend to have a higher customer lifetime value since they regularly engage with your products or services and require less marketing effort to retain. In contrast, new customers need time, attention, and incentives before they become regular buyers. While new customers offer growth potential, loyal customers provide a steady and reliable source of revenue, making them vital for long-term business success.
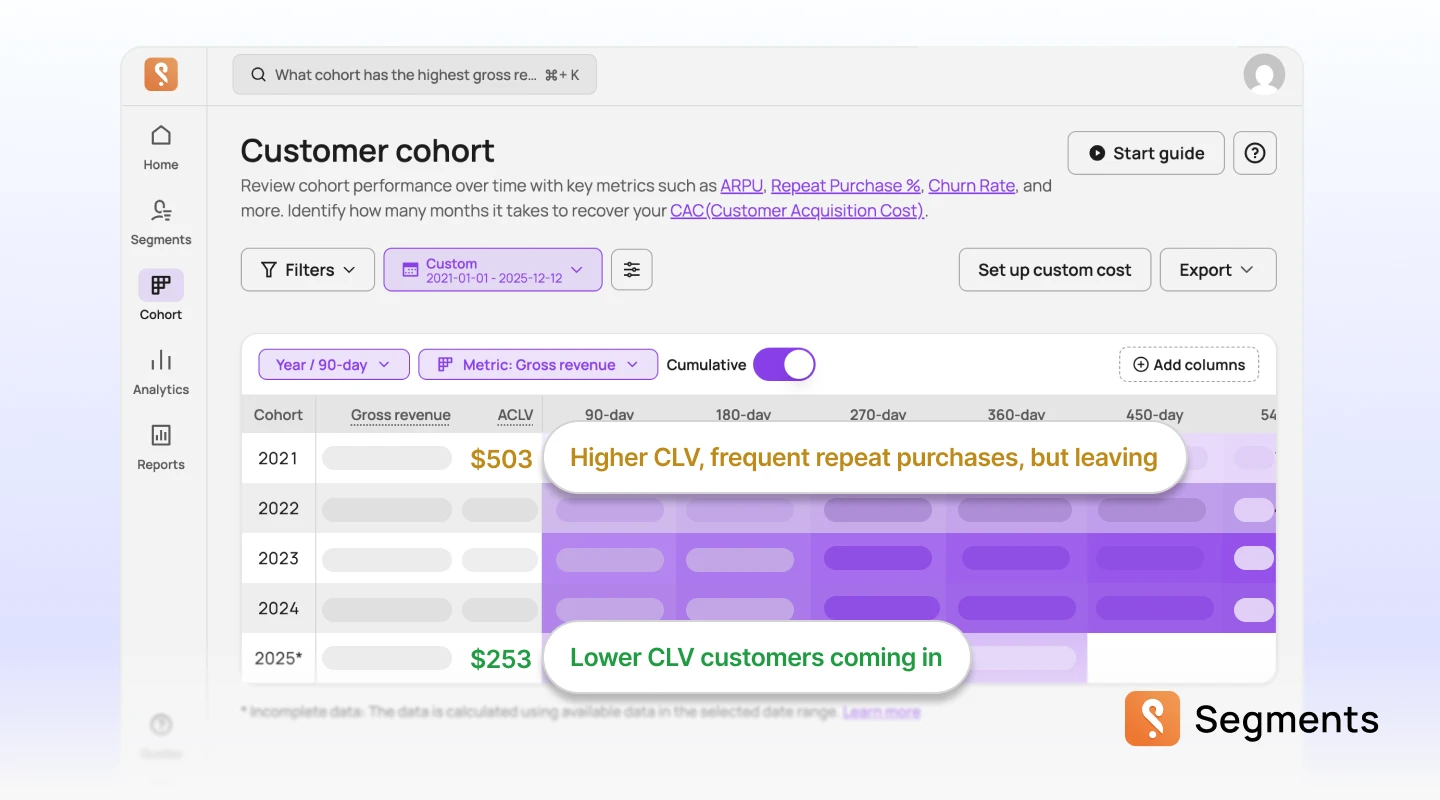
The 2021 Cohort: This group has built strong customer relationships with your brand, making repeat purchases at full price. They are the engine of your loyalty programs and require almost zero ad spend to retain.
The 2025 Cohort: These customers cost more to acquire and typically need nurturing to develop trust and become loyal buyers.
It’s important to remember that it is up to 50 times cheaper to retain existing customers than to acquire new ones. Treating these two groups as equal active customers can lead to a false sense of security, essentially trading long-term brand equity for short-term paid traffic. By distinguishing between cohorts and tracking their behavior, businesses can focus retention efforts on valuable customers and optimize acquisition strategies for sustainable growth.
By tracking the movement flow alongside cohort sales, this brand can identify issues early and execute a precise retention marketing strategy:
A stable customer count can hide a rotting customer base.
Don’t just count the heads in the room. Look at who is leaving through the back door, and who you are letting in the front. By shifting your focus from total active to net movement, you stop managing a list of emails and start managing the actual health of your business.
If you are looking at your own data today, use these three logic checks to diagnose your store’s health:

