
Most image to Excel conversion failures trace to the input, not the converter: borderless tables collapse into one column, OCR outputs numbers as text, and poor image quality drops data. For ecommerce operators digitizing supplier sheets, built-in tools handle clean tables and a dedicated converter handles the messy ones.
The problem is almost never the converter. It is the input. Fix the image or the table, and the tool you already blamed usually works fine.
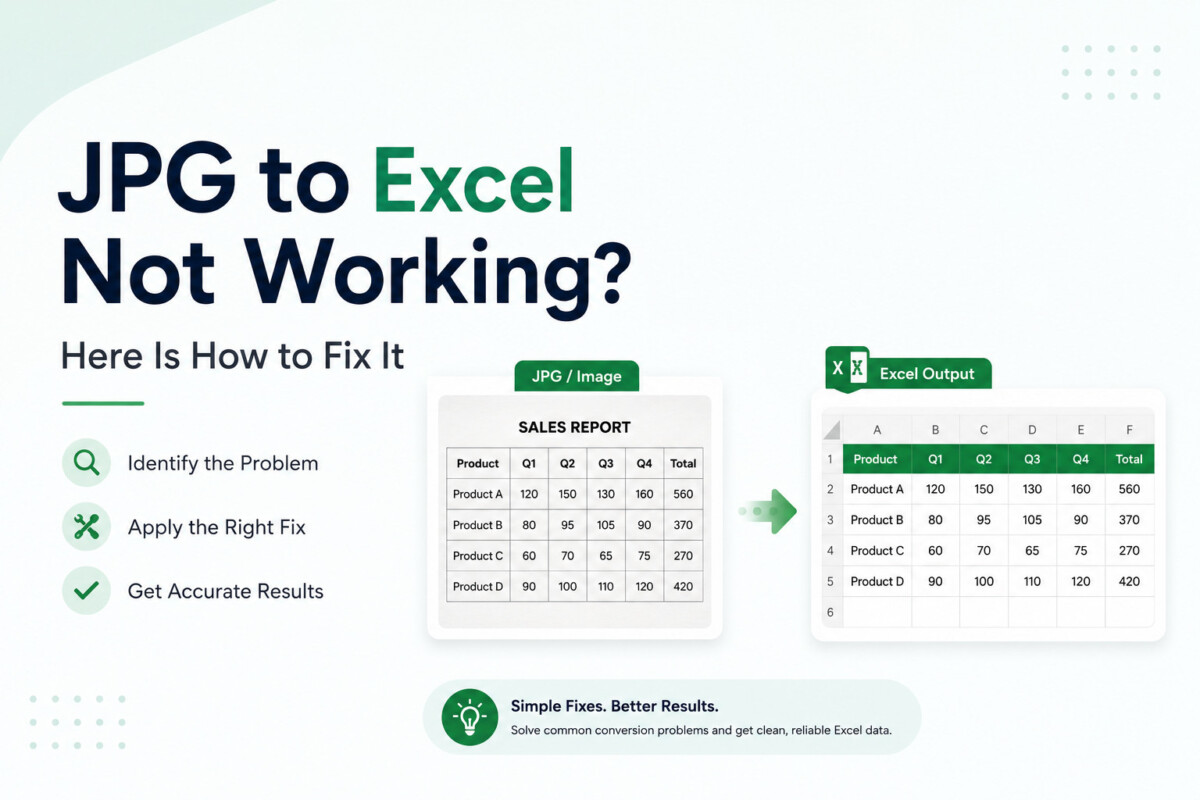
You uploaded the image. The tool ran. The file downloaded. You opened it, and the data is wrong—columns are merged, numbers are missing, or the whole thing came out as one unreadable block of text.
This is not a rare experience. It happens regularly, and almost always for one of a small number of fixable reasons. This guide covers the most common conversion failures, their causes, and exactly what to do to achieve a clean result.
This is the most reported conversion failure. All the data lands in column A as a single string of text instead of spreading across multiple columns.
The cause is almost always a borderless table. OCR engines detect columns by reading the visual boundaries between them. When a table uses spacing instead of visible lines to separate columns, a basic engine reads the entire row as one continuous string.
Three fixes work for this:
Switch to a tool with advanced table detection. For borderless tables, you can convert JPG to Excel with WPS’s online converter, which handles both bordered and borderless tables without any preprocessing.
Add borders to the image before uploading. Open the image in any photo editor. Draw simple lines between columns. Save and upload. The engine now has visible boundaries to work with.
Convert the single-column output using Text to Columns in Excel. Go to the Data tab, select the affected column, and run Text to Columns. Choose Delimited or Fixed Width depending on how the data are separated. This reconstructs the column structure from the merged output.
You sort the column, and nothing moves in numerical order. Check the status bar. A count means text. A sum means numbers.
This happens because OCR outputs everything as strings by default. The conversion tool extracts characters — it does not assign data types. Excel receives the characters and treats them as text unless told otherwise.
Fix it in three steps. Select the affected cells. Look for the small green triangle in the corner of each cell—that is Excel flagging a number stored as text. Select Convert to Number from the warning icon that appears. For larger ranges, use the Data tab and run Text to Columns with the General format selected. This forces Excel to reassign data types based on content.
Partial data loss after conversion points to one of two causes: image quality or layout complexity.
Low contrast areas in the image—shadows, faded ink, and paper creases—make text invisible to OCR. The engine skips what it cannot read. The output has gaps where the unreadable content was.
Fix this by improving the image before converting. Increase brightness and contrast in any basic photo editor. Even a small adjustment can make faded text readable. A fresh photo in good lighting beats spending time fixing a bad one.
Complex layouts create a different problem entirely. Merged cells, nested tables, and multi-level headers confuse basic OCR engines. The engine cannot reconstruct the relationship between cells and drops content rather than guessing wrong.
A more capable tool extracts data that basic OCR misses entirely. It reads the table as a whole, not character by character.
Two separate tables come out as a single merged block. Or one table gets split across two separate output ranges. Or rows from the footer end up in the middle of the data.
This is a table boundary detection failure. The OCR engine did not correctly identify where the table starts and ends.
The fix depends on the direction of the error. If two tables are merged, check whether your tool supports multi-table detection. Some tools output each detected table as a separate sheet. No multi-table support? Crop each table into its own image before uploading. Process each table as a separate file.
If one table is split incorrectly, look for a visual break in the original image — a gap between rows, a page fold, a shadow line — that the engine misread as a table boundary. Remove the visual break by editing the image before converting.
A date shows as a five-digit number. A currency value loses its decimal. A percentage appears as a whole number.
These are formatting errors, not conversion errors. The data was extracted correctly, but Excel applied the wrong format to the cells.
Select the affected cells. Right-click and choose Format Cells. Apply the correct format—Date, Currency, Percentage, or Number—with the appropriate decimal places. The underlying data is already correct. Only the display needs adjusting.
For dates specifically, check whether the regional format matches your system. A date extracted as DD/MM/YYYY may display incorrectly on a system set to MM/DD/YYYY. Fix this by selecting the date column, running Text to Columns, and specifying the correct date format in the Column Data Format step.
The tool returns an error before processing even starts. The upload fails or times out.
Three causes account for most upload failures.
File size. Free tiers on most tools cap uploads between 5MB and 10MB. High-resolution scans and multi-page documents exceed this easily. Compress the file first, or use a tool that accepts larger uploads.
File format. Not every tool accepts every file format. A file saved as HEIC, TIFF, or BMP may be rejected. Convert to JPG first, then upload.
File corruption. A JPG that has been re-saved many times or transferred incorrectly can become corrupted. Open the file in an image viewer to confirm it displays correctly before uploading. If it does not open, the file itself needs to be recovered or retaken.
Do not test with a clean, simple file. That tells you nothing useful about how the tool handles your actual documents.
Test with the most difficult file in your batch. The one with the worst lighting, the most complex layout, or the most degraded print quality. Run it through the tool before committing to a full workflow. If the output on your hardest file is usable with light editing, the tool works for your needs.
WPS’s online converter handles the range of failure cases covered here. You can convert JPG to Excel directly in the browser—no account, no conversion cap—and the tool’s table detection handles both bordered and borderless tables without preprocessing.
Some documents genuinely do not convert well with any automated tool. Heavily degraded originals, fully handwritten tables, and documents with non-standard layouts all have limits that OCR cannot reliably overcome.
In these cases, a hybrid approach works better than repeated failed conversions. Use a JPG to Excel converter to extract whatever it can reliably read. Accept partial output. Then manually complete only the sections the tool missed. This is faster than full manual entry and faster than running failed conversions repeatedly.
Most JPG to Excel conversion failures have a fixable cause. Column collapse points to borderless tables. Missing rows point to image quality or layout complexity. Numbers as text is a formatting issue Excel resolves in seconds. Upload failures point to file size, format, or corruption.
Identify the specific failure before trying a different tool. The problem is usually in the input, not the converter.
The table in your image likely has no visible borders between columns. Basic OCR engines cannot detect column boundaries without visible lines. Switch to a tool with advanced table detection, add borders to the image before uploading, or use Excel’s Text to Columns feature to reconstruct the structure from the merged output.
OCR outputs all content as text strings by default. Select the affected cells in Excel, look for the green triangle warning, and use Convert to Number. For larger ranges, run Text to Columns from the Data tab with the General format selected.
Some parts of the image were unreadable. Shadows, faded ink, and paper creases are common reasons. OCR misses data. Try boosting brightness and contrast before uploading. Merged cells and multi-level headers trip up basic OCR. A more capable tool handles them better.
Excel applied a numeric format to cells containing dates. Select the date cells, right-click, choose “Format Cells,” and apply the “Date” format. If dates are in a non-local format, run Text to Columns and specify the correct date format in the last step.
First, check the file size. Every tool has an upload limit — know it before sending. Second, check the format. Not all tools take HEIC, TIFF, or BMP. Convert to JPG first. Third, open the file before uploading. If it does not open on your device, it will not convert either. Retake or recover it first.
The table in your image most likely has no visible borders between columns. Basic OCR engines detect columns by reading the lines between them, so a table that uses spacing instead of gridlines gets read as one continuous string per row. You have three fixes: add borders to the image in a photo editor before uploading, use Excel’s Text to Columns feature to rebuild the structure from the merged output, or switch to a converter with stronger table detection that handles borderless tables natively. This failure is especially common with supplier price lists, which are often laid out with spacing rather than visible gridlines.
OCR outputs all content as text strings by default, because the tool extracts characters without assigning data types. You can confirm it by selecting the column and checking the status bar: a count means text, a sum means numbers. To fix it, select the affected cells, look for the small green triangle flagging a number stored as text, and choose Convert to Number from the warning icon. For larger ranges, run Text to Columns from the Data tab with the General format selected. This matters before any margin or cost calculation, because a price column stored as text will not total or feed a formula correctly.
Parts of your image were unreadable to the OCR engine, usually because of low contrast or a complex layout. Shadows, faded ink, and paper creases make text invisible, so the engine skips it and leaves gaps. Boost brightness and contrast in a basic photo editor before converting, or retake the photo in better light. Merged cells, nested tables, and multi-level headers cause a different failure, where a basic engine drops content it cannot reconstruct. A more capable tool that reads the table as a whole rather than character by character recovers much of what basic OCR misses, so the layout is worth checking before you blame the data.
You can, but convert it to a clean spreadsheet first and verify the data before mapping it to a Shopify CSV, because import errors propagate across your catalog. Run the image through Excel’s built-in feature or a dedicated converter, then check the columns that matter most: SKUs, prices, and any values headed into cost or margin fields. Confirm numbers are stored as numbers, not text, and spot-check currency cells against the original. Only once the spreadsheet is accurate should you arrange it into Shopify’s import column structure. Better still, if the supplier can send the data as a CSV directly, use that and skip the conversion entirely.
Excel can convert an image to a spreadsheet for free using its built-in Data from Picture feature, which is available at no cost in the Excel mobile app and in Microsoft 365. For clean, well-lit, bordered tables, this is often all you need, and Google Sheets offers similar OCR through Google’s tools. Paid or dedicated converters earn their place on the harder cases: borderless tables, complex layouts, and lower quality phone photos that the built-in tools struggle with. Start with the free option you already have, and only reach for a dedicated converter when your source document defeats it.

