

![]()
by Klevu on Dec 01 2020
This article is in continuation to our previous post on Black Friday (BF) insights. Cyber Monday (CM) is always good to analyse to better understand how it compared to BF of the same year and then CM of the previous year. We clearly see a trend this year that BF 2020 was by far ahead of the curve compared to CM 2020. However, there is a steady increase in CM 2020 sales against 2019. For example, this CM, we served 20% more shopping interactions compared to last year, however BF 2020 was 57% higher in sales than CM. We are also proud to share that Klevu AI brought a 22% higher conversion to our customers this Cyber Monday. In terms of traffic, we saw the United States at the helm with 5.4 Million plus events recorded, maintaining its top rank compared with Black Friday.
If you are a Klevu customer, subscribed to an applicable plan, you can also see Live View inside Klevu Merchant Center.
Please find more collective and comparable insights from Klevu Analytics in this article and stay tuned for more insights :).
We started Cyber Monday data analysis at 00:00 GMT on Nov 30 and concluded at 12:00 GMT on Dec 01. We dissected numbers at various data points such as region/location, devices, revenue and industry domains. We are proud to present some useful insights and cumulative figures this year. All figures presented in this report are based on the analysis of tracked events on the Klevu powered stores.
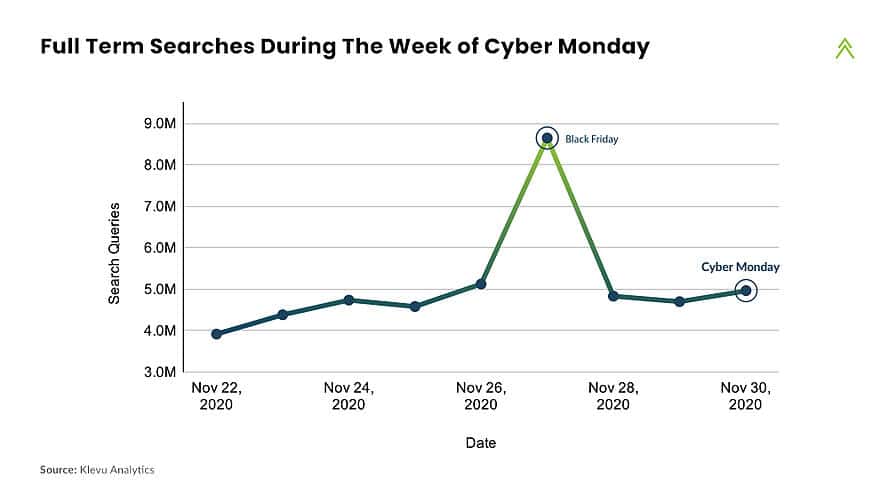
Given the virtual nature of Cyber Monday, we decided to analyze terms searched on Black Friday and Cyber Monday. We created a WordCloud that will help our Klevu customers to visualize what shoppers were after during the two banner sales events. We present to you the top 200 search term clicks across Black Friday and Cyber Monday represented by their click frequency as the term size.
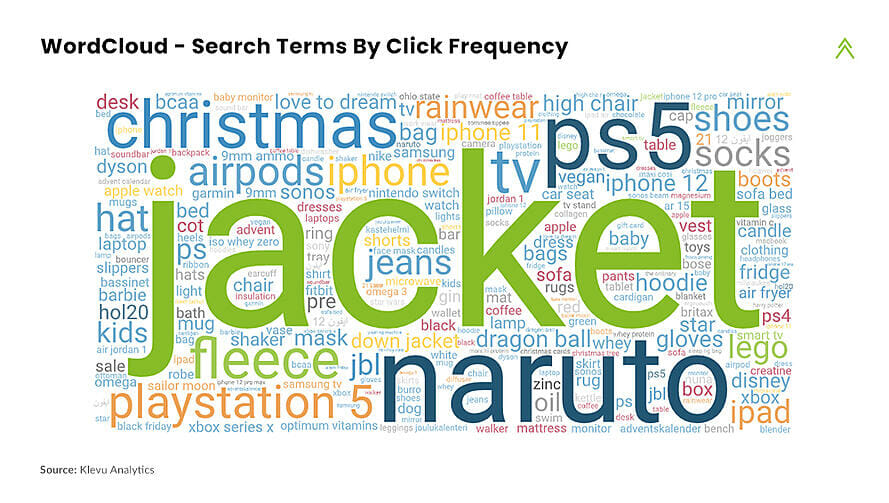
The word cloud clearly depicts that aside from clothing, shoppers turned to technology and electronics this BF & CM. It is also interesting to note a massive frequency of click terms for Apple products such as iPhones and AirPods given the company recently announced a line of fresh gadgets just before Thanksgiving week and shoppers rushing to claim discounts on flagship products.
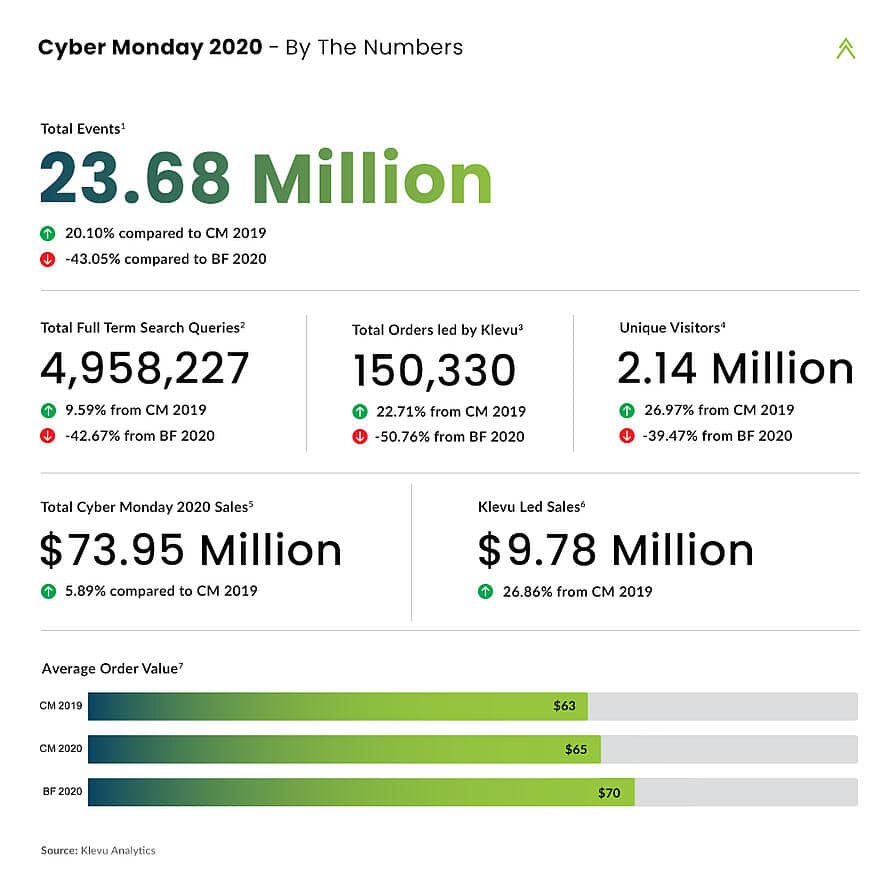
“Cyber Monday 2020 recorded an increase of 27% in sales led by Klevu compared to last year’s CM“
We saw the click through rate (CTR) increase by 10% compared to 2019 Cyber Monday, while click conversion rate relatively maintained its rate compared to 2019. Klevu led sales for Cyber Monday saw a 14% increase compared to the Black Friday event.

“Klevu led sales on Cyber Monday increased by 20% from last year’s event“
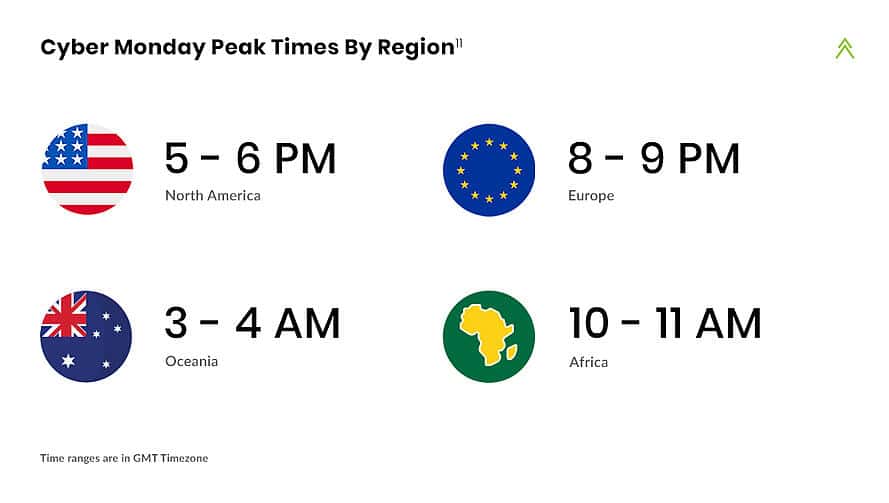
“Cyber Monday saw shoppers in USA place highest orders between 9 – 10 AM PST , while in the UK, shoppers emptied their wallets between 8 – 9 PM GMT“
Traffic on Cyber Monday saw a decline compared to Black Friday; specifically a 40% decline from Black Friday 2020, of which 51% events were recorded from desktops alone. Smart phones contributed 47% traffic on Cyber Monday, a moderate 16% increase from last year.

“Desktop surfers dominated traffic this Cyber Monday, accounting for over 51% share“
CM 2020 showed Croatia record the highest Click through rate of 101%, followed by 90% and 73% in Serbia and Poland, respectively. However, the highest click conversion was recorded in Ireland with a ratio of 21% followed by UK and Greece.
Overall Click through rate was steady and consistent compared to Black Friday 2020 and increased by 10% from CM 2019. Here are the top five country charts with highest CTR and Click Conversions.
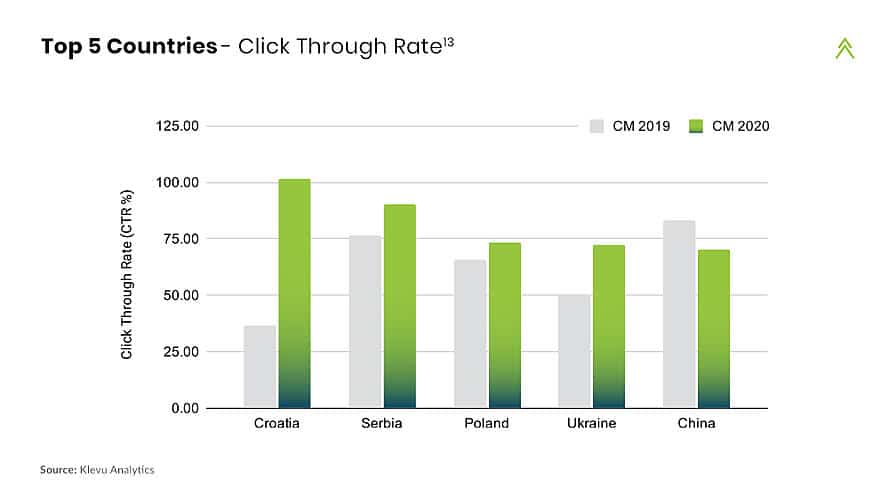
“The European region saw the highest CTR, with Croatia leading the pack at 101%“
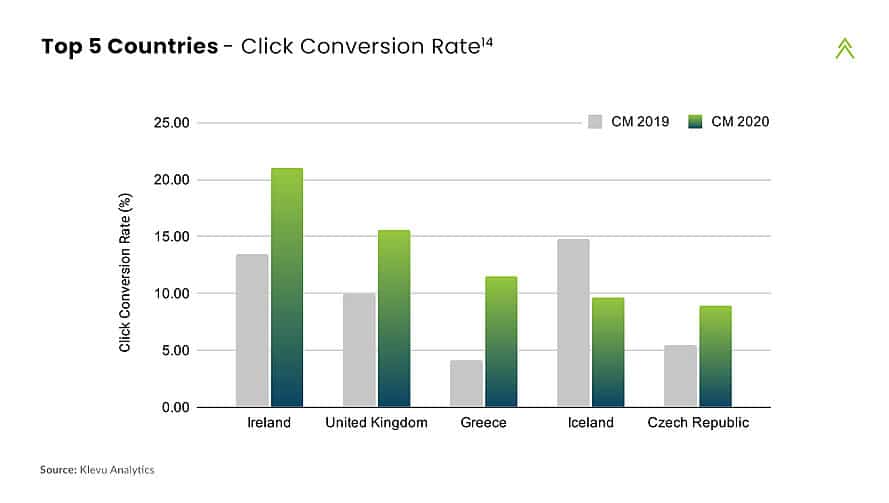
“Ireland remained at top on Black Friday and Cyber Monday, by recording click conversion rate at an impressive 21%“
Traditionally, the Black Friday event dominates in-store purchases while shoppers turn to their laptops and mobile devices for Cyber Monday. However, the year 2020 saw a majority of the purchases taking place online for both events. Cyber Monday saw the most spends in Home & Kitchen, Electronics, and Beauty & Health depicting a consistent spending compared to Black Friday. The following charts show insights of the top five domain/industry spendings within each region.

“Shoppers in North America emptied their wallets on Home & Kitchen and Beauty products on this year’s Cyber Monday event“

“More than 53% of spendings from the European region were made on products from Home & Kitchen & Electronics categories“

“Similar to Black Friday, shoppers from Australia & New Zealand predominantly shopped for Mobiles, Accessories & Electronics products on Monday accounting for a total share of 80%“

“Over 67% sales from the Asian region accounted for Home & Kitchen products alone“

“Sales from Africa saw Cyber Monday spendings in the same Software & Electronics categories as they did on Black Friday accounting for 72% share“
Considering that the last week of November was a full fledged digital ecommerce event, it comes as no surprise that the Cyber Monday figures come lower than Black Friday. In light of many countries still imposing lockdowns and restrictions, it seems that retailers have continued to offer discounts and deals throughout the preceding week leading up to Cyber Monday.
We will continue to bring more insights and innovate further as we progress towards our commitment to democratise discovery in retail. CM or BF or such days are points of intersection where we get more time and opportunity to reflect on how shopping overall is evolving. Once again, we thank our customers, partners, team and suppliers who help us make things happen! Stay tuned 🙂
1) Total Events – Total events constitute keystrokes, full term searches, product clicks, category views and checkout events. 2) Total Full Term Search Queries – Full search term queries refer to events when a complete search query is entered. E.g. “gol” vs. “golden ring”. 3) Total Orders – Number is indicative for a data window from 00:00 GMT Monday, Nov 30 to 12:00 GMT Tuesday Dec 01. 4) Unique Visitors – Total tracked unique IP addresses for all events for the window 00:00 GMT Monday, Nov 30 to 12:00 GMT Tuesday, Dec 01. 5) Total Cyber Monday 2020 Sales – Total Klevu led and non-Klevu led sales tracked on Klevu powered stores. 6) Klevu Led Sales – Revenue data tracked by Klevu corresponding to checkouts led by Klevu product clicks. FX used for USD conversion is rate as on Cyber Monday 2020. 7) Average Order Value – An average value of checkout order tracked by Klevu. Note that average order value is only an indicative figure and does not include refunds, order cancellations, failed transactions or the checkouts not yet delivered to the Klevu analytics backend. 8) Click Through Rate – The measure represents the ratio of users who click on products against how many times a search was made. 9) Click Conversion Rate – The ratio represents users who checked out against total users clicks from search results. 10) Sales Through Klevu Rate – Contribution of sales through Klevu against sales of the entire store. Note that sales through Klevu is only an indicative ratio and does not include refunds, order cancellations, failed transactions or the checkouts not yet delivered to the Klevu analytics backend. 11) Black Friday Peak Times by Region – Time window where most orders were received in a region. Note that data tracked is for the window 00:00 GMT Monday, Nov 30 to 12:00 GMT Tuesday, Dec 01. 12) Device Usage – Search event originating from type of device. All events originating from other than Mobile or Desktop have been aggregated in “Tablet & Others”. 13) Top 5 Countries – CTR – Actual CTR ratios per country may differ. Represented CTR ratios are indicative based on the data window from 00:00 GMT Monday, Nov 30 to 12:00 GMT Tuesday, Dec 01. 14) Top 5 Countries – CCR – Actual CCR ratio per country may differ. Represented CTR ratios are indicative based on the data window from 00:00 GMT Monday, Nov 30 to 12:00 GMT Tuesday, Dec 01. 15) Top Industries by Region – Actual revenue share per each industry may differ. Revenue data represented accounts for 50% stores for the window from 00:00 GMT Monday, Nov 30 to 12:00 GMT Tuesday, Dec 01.

