


Full control, fully remote. Only the metrics you need to know, with the agility to look closer and react quickly. Stay in the know without being physically present.
Do you switch multiple screens and views to understand what’s going on with your team? If you do, we’re happy to report that there is now a shortcut. ? Live Statistics on Gorgias is your destination to get a quick overview of ticket volume, agent activity and active channels in real-time.
Where is it?
It’s up top! Once you navigate to Statistics, you will see Live Statistics conveniently placed at the top. Click on Overview to see a snapshot of all customer support activity over all channels and agents.
Ok, what am I looking at?
In Live Overview, you will see the number of Agents Online and offline. Next to these, you will find the numbers of Open Tickets in two sections (to indicate whether they’re assigned or unassigned).

Pro tip: Hover over the tooltip to see a quick list of the actual agents who are online and offline. ⬇️

Consider the number of Agents Online compared to Open Tickets
Say it’s late afternoon and you’re seeing a spike in open tickets. In Live Overview, you read 60 Open Tickets, and only 2 Agents Online. → 30 tickets per person ?
With this information, you can immediately make decisions and take action on how to handle the higher volume your team is experiencing. For example, you may consider:
• Going to Live Agents Statistics to see the number of Chat tickets
• Creating a macro and a rule for your Chat customers who are waiting for longer than 1 minute ⌛️
• Creating a macro and a rule to set expectations around the delay
• Check internally to see if there is a problem with your delivery ops
• Stepping in to answer tickets with the Urgent tag
Knowing exactly what’s going on as it happens live, later observing fluctuations in First Response Time or Resolution Time won’t catch you by surprise. You can make a better assessment on your team’s performance by being fully aware of the circumstances around your metrics.
In Live Statistics, we simplify and organize information so you can be fully aware without needing to contact your team personally or be physically there.
Monitor Support Volume live
In Live Overview, you will see a nice graph to inform you on the hourly Support Volume. Use this graph to see how your team is responding to inquiries as they emerge.

Looking at this graph, you can quickly grasp the volume you’re getting by the number of Tickets Created, Tickets Replied and Tickets Closed separately, but on the same timeline so you can compare.
Observe when Tickets Created see a spike, compare it to Tickets Replied
When do you receive the bulk of inquiries? Does it happen before business hours?

You can see above an example where a lot of customers decided to contact the support team throughout the night. As a manager, you can monitor to see if this is a consistent pattern over time, and develop strategies on the support and operations side to improve experience. Looking at this graph, and seeing this type of pattern, you may want to ask:
• Are these tickets urgent? Are we properly auto-tagging to identify urgency?
• Are my agents ready to tackle this ticket volume at the beginning of their shift?
• Are these tickets auto-assigned?
• If these inquiries are urgent, should we set autoresponders?
• Is it worth getting additional staffing or how can I leverage self-service?
Monitoring the Support Volume graph, you can start to detect patterns that are connected to the entire customer experience. Anticipating problems or delays before they can occur, you can take measures to improve CSAT despite the predicaments due to international shipping challenges or a mix-up on a batch of orders etc. You can use the visibility and insights from Live Statistics to inform your overall operations.
Live means real-time
Live Statistics is designed to inform you on an hourly basis. It gathers the right metrics and combines them strategically so you can get the right information and react quickly without being there.
All metrics in Live Statistics reflect your current day from 12:00 am to 11:59 pm in your time zone. If you need to change the time zone, you can easily do this in Business Hours under Settings.
Who is working?
In Live Agents, you will see whether each team member is currently online or offline, indicated by a green dot if they’re online – ? working away, or an orange dot indicating that ? they’re offline.

Pro Tip: Hover over these dots to see when they signed in (on the green dot), and when they were last seen that day (on the orange dot).

Live Agents Statistics will show you the exact amount of time each team member has been online in hours and minutes (e.g. 2h 6m). On this table, you will also see the number of Tickets Closed and Messages Sent. The ability to see this exact combination of data per agent will really help you monitor your team’s efficiency and know which agents to coach to improve performance.

Have all of your team use this, so everyone can self-check ? and have their sense of achievement for the day based on data – ? not just feelings. Reviewing Live Statistics as a team, you can collaborate to come up with effective strategies to reduce the rate of messages sent per ticket closed.
Who is working on what?
Located in the far right column, Open Tickets ? feature makes Live Statistics whole. This is where you can clearly see who’s working on what. You can see the total number of open tickets currently being helped by each team member. Placed immediately next to this number is the breakdown by channel.
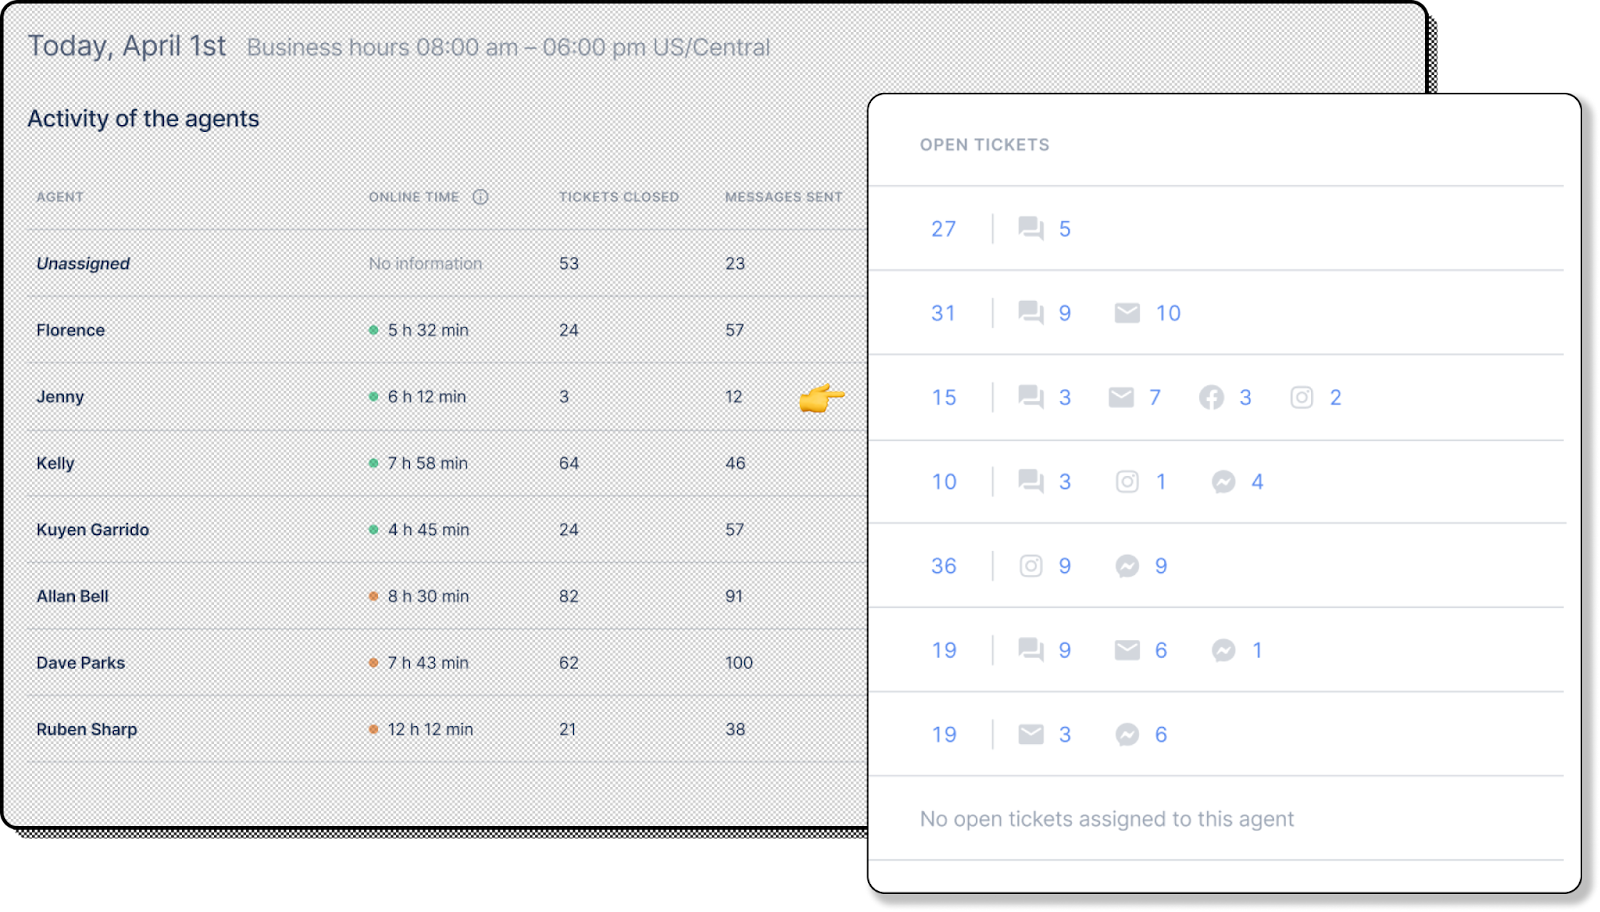
You can read above how Jenny has 15 open tickets, with 3 from Chat, 7 from Email, 3 from Facebook and 2 from Instagram.
Click on this number to see just exactly what Jenny’s working on. Each of the numbers provided under Open Tickets, the total and by channel, is clickable and it will bring you to a readily filtered view where you can take a closer look at what your agent has at hand.
This experience will help you review your team’s activity in microscopic detail as you desire, without needing to interfere or navigate to different Views.
Help your team on the spot
Check out the full combination of Online Time, Tickets Closed, Messages Sent and Open Tickets. Let’s bring back Jenny and look closer to see that she has 3 Tickets Closed, 12 Messages Sent and 15 Open Tickets. Under Online Time, it reads 6h 12m so she is approaching the end of her shift.

Right away, we can notice that she’s approaching the end of her shift with a lot (15) more tickets to go. There’s no need to get alarmed, but it’s better to take a quick look at what’s going on. Clicking on the number listed under Open Tickets, we can easily review the tickets she’s working on. Taking a quick look at her tickets, we notice a shipping problem on multiple orders – all large items shipping internationally with a third party. Knowing Jenny’s not familiar with third party shipping, we can remove these tickets from Jenny’s queue and make sure that we mark our calendar to train her on this topic before BFCM hits. ✅
All of these features in Live Statistics, Overview and Agents are designed to give you full visibility and control so you can take timely action to remove stress from work and from your team. ?
