

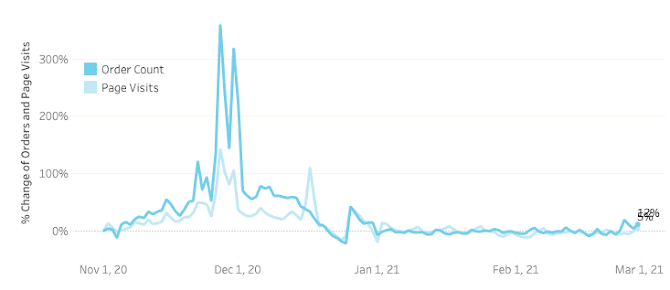
Prior to the Holidays, consumer behavior had clearly become more predictable, with purchase volumes consistently around 1.4x to 1.7x where they were before the pandemic (this was after a giant surge in April, May and June). So remember that is the baseline we’re dealing with in the chart below.
After the Holiday surge, ecommerce purchase volumes settled to similar levels to where they were pre-Holiday (i.e. in the range of 1.4x to 1.7x where they were pre-Covid).
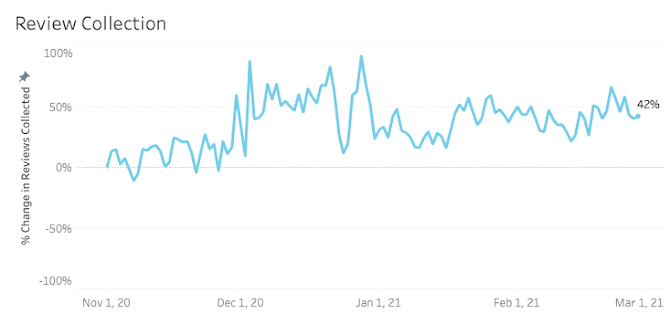
In the last snapshot, we noted a surge in review submission volumes – when we saw the biggest increase in review collection of the year, with a giant surge evident at the end of November.
This trend – broadly speaking – held throughout the entire month of December – and on December 28 actually peaked at a level 90% higher than where it was at the start of October.
Interestingly, this broad trend continued throughout January and February – this is potentially a hangover from the significant increase in sales volumes over the Holidays. But – as our recent survey proved – most consumers leave reviews within a week of receiving a product having used it once or twice.
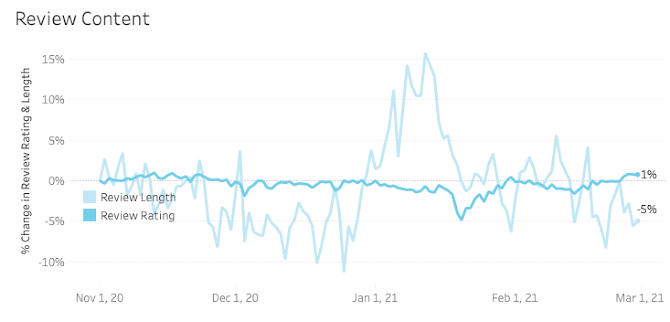
Despite the increase in volumes, trends evident in review length and sentiment were broadly consistent with everything we saw throughout 2020. However, there was a very slight dip in length – fluctuating at a maximum of -10% and +15% of where they were at the start of November – during this period.
Over the last few monthly snapshots, we have included a deep dive into the
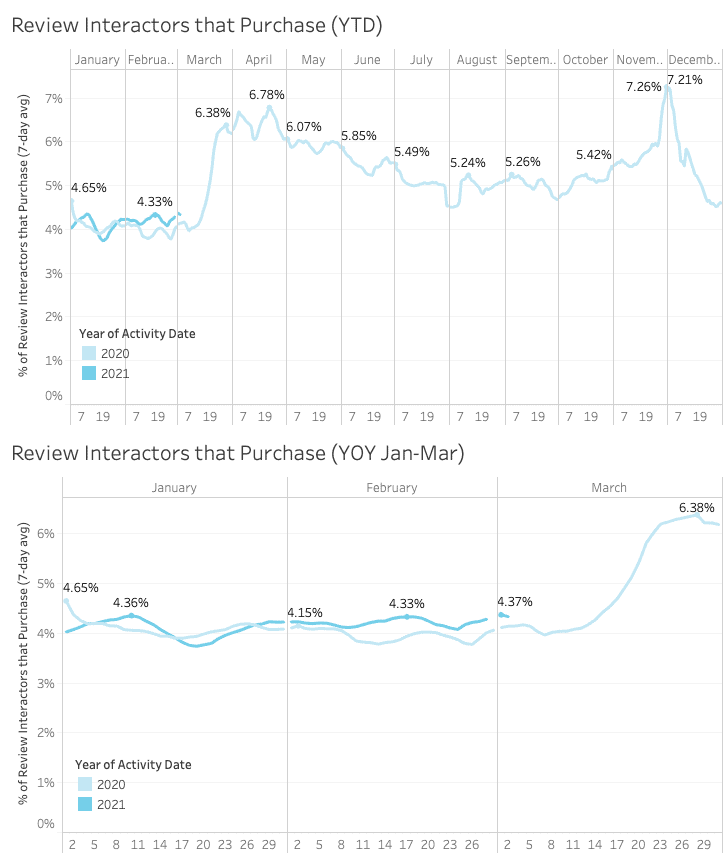
To recap, the charts in this section highlight the percentage of online shoppers who go onto purchase after they’ve interacted with review content (i.e. searched, filtered, clicked to extend the review from preview to view entire content etc.)
We found that review interactors were consistently converting at around a 25% higher rate than they were a year previously (the conversion figure is typically around 5.25% in the three months prior to Black Friday, compared to around 4.25% in the same period for in 2019).
For context, this figure had come down from its Covid peak (as also demonstrated below) of 6.85% in April. This is in line with when we saw the highest ecommerce purchase volumes (when they hit a peak of 210% above where they were pre-COVID at this time).
However, the influence of reviews surged to their highest rate of the year during the 2020 Cyber 5, with 7.41% of review interactors going on to purchase (an increase of 30%). As you can see from the charts, this is entirely in line with typical trends. Reviews always become more impactful on the buyer journey during the Holidays.
During January and February 2021, reviews continued to be more influential on the buyer journey than they were a year prior. But the difference was much less marked. We’ll wait before calling this a trend in light of what we saw pre-Holidays.
In summary, we noted the following clear trends:
Realistically, as we look ahead to the rest of 2021, it’s likely that 2020 accelerated the transition online like no other event in the Internet age. More sustainable growth is likely in a post-Covid world – as the below projected chart from eMarketer outlines.
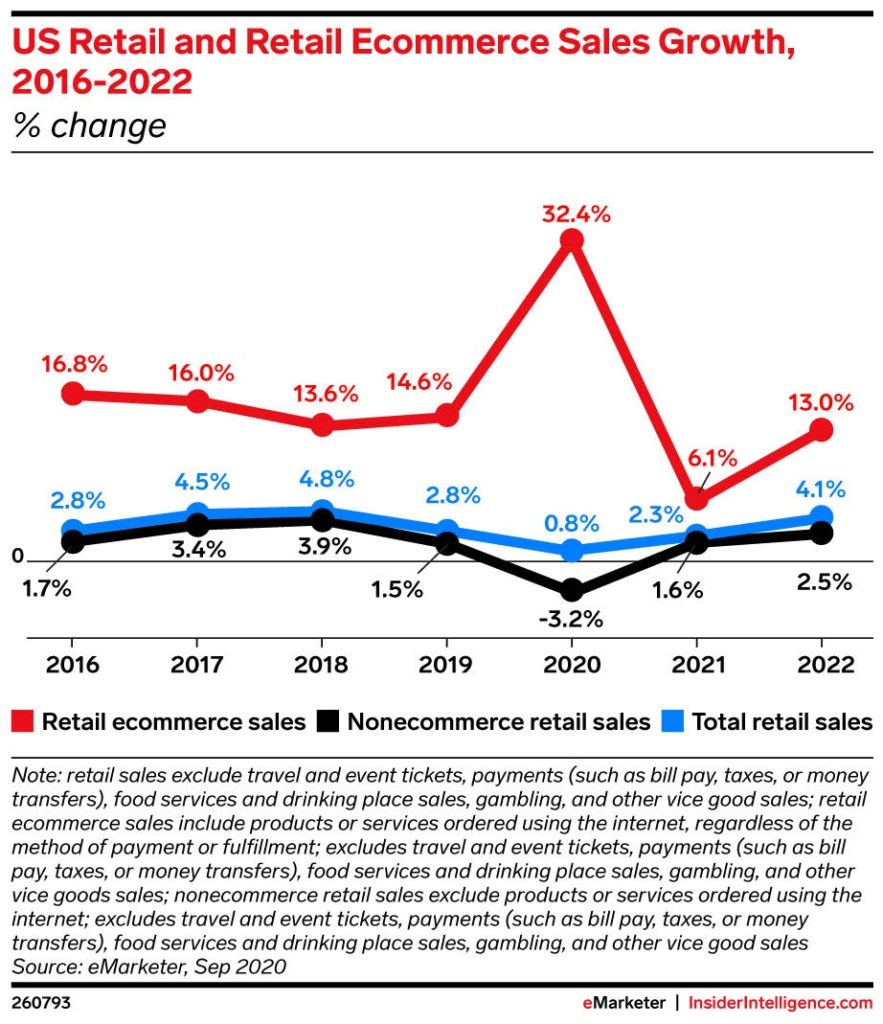
In fact, eMarketer predicts that ecommerce growth in 2021 will be significantly less than half of where it was in 2019. However, coming off the back of the biggest year of ecommerce growth in history (32.4% year-on-year according to eMarketer), the overall trend of an increasing share of dollars being spent online (compared to instore) is a continuing and unpreventable process.

