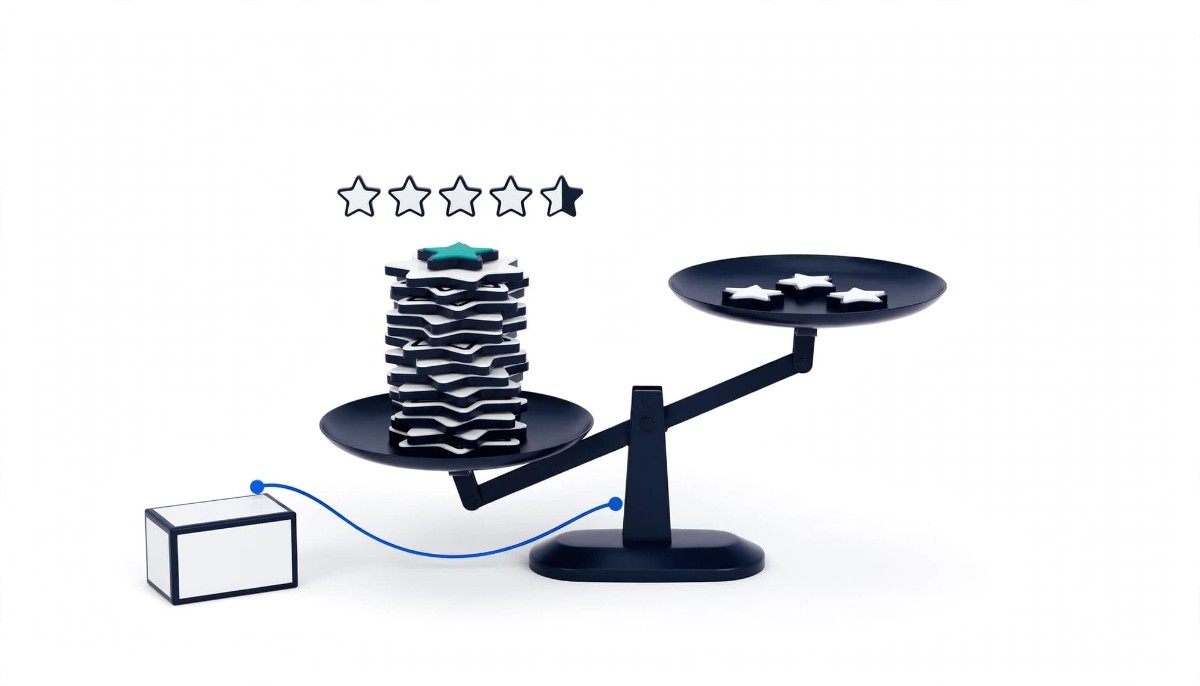
The best-converting average star rating sits just below perfect, roughly 4.2 to 4.99 depending on the dataset, while a 5.0 average converted about as well as a 3.0 to 3.49 product in one large benchmark. Review volume, displayed rounding and visible negative reviews matter more than chasing 5.0.
A 5.0 rating on six reviews is not proof. To a shopper, it reads like a product that has not been tested yet, or a store that has been tidying up.
Most merchants I talk with treat their star rating like a grade. Anything below a 5.0 feels like a deduction, and every three star review triggers a scramble to bury it, refund it, or argue with it. That instinct made sense when reviews were scarce and any blemish stood out. It does not match what shoppers actually do now, and it does not match the data.
Shoppers read a rating as evidence, not as a grade. They want to know two things: is this product good, and can I believe what I am being told? A 4.7 average on 900 reviews with a visible handful of complaints answers both questions. A 5.0 on eight reviews answers neither. The first looks lived in. The second looks unproven, or curated.
This guide walks through what the large datasets say about star ratings and conversion, where they disagree, what a guest on the eCommerce Fastlane podcast learned about half star thresholds on Amazon, and how to turn all of it into a short list of products worth fixing in your own store. Whether you are doing $10K months or $1M months, the audit at the end works the same way. Only the number of products changes.
The best-converting average rating sits below a perfect score, somewhere between about 4.2 and 4.99 depending on which dataset you trust, and both of the large studies on the question found that a perfect 5.0 underperforms the band just beneath it. The disagreement is about where the peak sits, not about whether perfection helps.
The older and more independent of the two is the Northwestern Spiegel Research Center study of online reviews, built on data from PowerReviews covering 111,460 consumer packaged goods products across 22 categories and published in 2015. It found purchase likelihood peaked for products averaging 4.2 to 4.5 stars and then fell as ratings approached 5.0. The researchers’ explanation was simple: shoppers treat a perfect score as too good to be true.
The newer dataset is the PowerReviews benchmark on average rating and conversion, which looked at more than 20 million product pages on over 1,000 brand and retailer sites, with ratings captured in March 2022. It put the best conversion in the 4.75 to 4.99 band, found the largest relative jump between 3.0 to 3.49 and 3.5 to 3.99 stars (about 20%), and found that products averaging a full 5.0 converted at roughly the same rate as products in the 3.0 to 3.49 band.
Two caveats before you act on either number. Both datasets come from PowerReviews, which sells ratings and reviews software, and the 2022 figures are the vendor’s own analysis rather than peer reviewed work. And neither study controls for review count, price, or category in a way that tells you what will happen on your product page. Treat them as direction, not as a target to engineer toward.
The direction is consistent, though, and it lines up with what shoppers say about themselves. On the same benchmark page, PowerReviews also cites its own shopper survey finding that 46% of shoppers are suspicious of perfect 5.0 averages. The practical reading for a Shopify store is this: get products above 4.0, keep the strong ones in the mid to high 4s, and stop treating a 4.8 as a problem to solve.
A perfect 5.0 converts worse because, in most stores, it only happens on products with very few reviews, and shoppers read the combination of perfection and low volume as a lack of evidence rather than as quality. The score is not the problem. What the score usually signals is.
Think about how a 5.0 average happens in a real catalog. A product with 400 reviews almost never holds a perfect score, because some customer always gets the wrong size, a damaged box, or a product that did not suit them. A perfect average is far more common on a new launch with six reviews, most of them from your most loyal buyers. So when a shopper sees 5.0, the honest inference is usually “new and thinly reviewed,” and that is exactly what makes them hesitate.
The second reason is that shoppers go looking for the bad news on purpose. The Spiegel research found negative reviews help establish trust and authenticity, and that star ratings carried more weight on higher priced items within the same category, where the purchase feels riskier. It also cited earlier PowerReviews research finding that 82% of shoppers specifically seek out negative reviews. A shopper weighing a $180 purchase scrolls to the one and two star reviews to answer a specific question: what is the worst thing likely to happen to me? If your reviews give them nothing, they cannot answer it, and they leave to find a product where they can.
This is why I push back when a merchant tells me their goal is a store full of 5.0 products. In my years as a Shopify Merchant Success Manager, the stores with the most convincing review sections were rarely the ones with the highest averages. They were the ones where a shopper could see a real distribution: mostly fives and fours, a few threes, the occasional one star with a calm, specific reply from the brand underneath it. That pattern reads as a business that ships a lot of product and stands behind it.
None of this means you should want bad reviews. It means a three star review about slow shipping, answered well, is not the threat it feels like. Our guide to handling negative product reviews without losing the sale covers the reply side in detail. The rating side is simpler: let the average land where honest customers put it.
Half star rounding means the rating a shopper sees is often not the rating your customers gave, so on any widget that rounds, a tiny change in the underlying average can flip the displayed stars from four and a half to four, or from four and a half to five. That flip is one of several levers on conversion, alongside review count and recency, not the only one.
Danan Coleman, CEO of eCom Triage, has worked with Amazon sellers on review problems for years, and he described the mechanic clearly when he joined me on episode 402 of the eCommerce Fastlane podcast. Explaining why a drop from 4.3 to 4.2 matters so much on Amazon, he said:
If you go from a four three to a four two, you lose that half star. So you’d go from a displayed four and a half star to a displayed four star. Now, this is dependent upon the category that you’re in. If your competitors are showing a four and a half or five star and you are a four, they are going to go to your competitor.
He put the cost of losing that half star at a 25 to 50% drop in sales on Amazon. Treat that as his estimate from his own client work on one marketplace, not as a measured benchmark for Shopify stores, and note that he also said much of an Amazon rating gain works through placement: more traffic, not necessarily a higher conversion rate. Whether the mechanism carries over to your store depends on your widget. Some review apps round stars to the nearest half, others fill stars fractionally and print the decimal beside them, so check how yours displays a 4.2 and a 4.3 before you treat any number as a threshold. The data also limits how far drawn stars explain things on their own: the PowerReviews benchmark notes that a 4.75 and a 5.0 both display as five stars on its widget, yet their conversion rates differ significantly. Shoppers read the count, the decimal, and the reviews themselves, not just the picture.
Danan also made a point that keeps this in proportion: ratings are relative to the category. His example was fat burners on Amazon, where a 3.8 can still sell well because competing products sit around three and a half stars. In my view the same logic applies on your own site and in search results. What matters is how your displayed stars compare with the products a shopper is weighing yours against, on your own collection pages and on the marketplaces and search results where your product shows up next to competitors.
So the useful question for any product is not “what is my average?” It is “how close is this average to a display threshold, and which way is it moving?” If your widget rounds, a 4.26 sitting just above the line where it drops to four stars deserves more attention than a 4.6 that has been stable for a year.
A product needs enough reviews that one new review cannot move its average across a display threshold, and my rule of thumb is to treat any product with fewer than about 20 to 30 reviews as a volume problem rather than a rating problem. Below that, the average is mostly noise, and products sitting close to a threshold stay sensitive well above it.
The arithmetic is unforgiving at low counts. Danan described a common Amazon failure where a product variation loses its link to the parent listing and stops sharing reviews. In his words: “let’s say it’s only got 10 reviews and it’s got three one star reviews. Well, you’re gonna display a 3.8 rating on that.” Seven happy customers and three unhappy ones produce a number that sends shoppers to the next product. The same product with 300 reviews and the same three complaints would average about 4.96.
Volume also matters for its own sake. The PowerReviews benchmark on review volume, based on more than 25 million product pages with data extracted in March 2022, reported a 76.7% conversion lift for products showing 1 to 100 reviews compared with products showing none, rising to 143% for 101 to 250 reviews. Again, that is vendor data and the page does not describe its conversion methodology in detail, so the size of the lift is less reliable than its direction. The PowerReviews rating benchmark also says shoppers now value review recency more than total volume, so a steady flow of new reviews matters as much as the running total.
Volume is also a gate for distribution outside your store. Google’s product ratings eligibility rules require at least 50 reviews across all your products before your submitted ratings can show on Shopping ads through the Product Ratings program. Free listings can still show aggregated reviews Google collects from other sources, but a store below 50 reviews cannot feed its own ratings into its ads, whatever its average.
If you are launching new products regularly, the low count phase is the part to manage. Our piece on launching a product when you have zero reviews covers seeding and sampling. For the steady state, the fundamentals in this playbook for growing customer reviews on Shopify still do the heavy lifting: a review app, a great product, and real follow up after purchase.
Hiding or filtering negative reviews because they are negative, while presenting the rest as your reviews, is prohibited for US businesses under the Federal Trade Commission’s rule on consumer reviews and testimonials, which took effect on October 21, 2024. Moderating spam, profanity, or off topic content is still allowed. Suppressing honest criticism to protect an average is not.
The FTC’s trade regulation rule on consumer reviews targets review suppression directly: displaying reviews in a way that implies they represent most or all of what customers submitted, when negative ones are being withheld because of their sentiment. It also bans buying reviews conditioned on whether they are positive, and gives the FTC civil penalty authority for first time violations. This is a legal summary from a publisher, not legal advice, and if you sell outside the US your own consumer protection rules apply as well.
In practice, three common review app habits deserve a second look under this rule. A setting that auto-publishes four and five star reviews but holds lower ratings for moderation, which is only safe if every honest review is then published regardless of its rating. A homepage carousel labelled “What our customers say” that pulls only five star reviews with no path to the full set. And a post purchase flow that offers a discount only to customers who leave a positive review. The first two are display decisions you can change in Judge.me, Okendo, Yotpo, or whichever app you use, in a few minutes. The third is a flow you should rewrite so the incentive, if any, goes to every honest review.
This is where the conversion data and the legal rule point the same way. The 5.0 a merchant gets by filtering is the score shoppers already distrust, and it now carries legal risk on top. The 4.7 you get by publishing everything is the one the data favours.
A store rating audit sorts every product by review count and displayed rating, then picks the two or three products where a fix will move revenue, and leaves the rest alone. Here is how I would run it on one store.
The store below is a labelled composite, built from patterns that come up repeatedly in Shopify store reviews rather than from any single merchant, and its figures are illustrative. Picture a home and kitchen brand doing about $1.5M a year on Shopify with 60 products and Judge.me as its review app. Three products stand out in the export. The hero cookware set has 1,400 reviews and a 4.8 average. A new knife block launched six weeks ago has seven reviews and a 5.0. And a mid-priced storage set has 64 reviews and a 4.24 average, displayed as four stars, with most of its low reviews complaining that the lids do not fit the advertised containers.
The founder’s instinct is to push the cookware set toward 5.0 and to protect the knife block’s perfect score. I would do neither. The cookware set at 4.8 on 1,400 reviews already sits in the best-converting band of the larger dataset, and an hour spent on it is an hour wasted. The knife block’s 5.0 on seven reviews is a volume problem, so the work is a sampling push and a review request at day 14 rather than any attempt to keep the score perfect. The day one of its first three star reviews lands is the day it starts looking real.
The storage set is the product to fix first, and the fix is not a review campaign. This store’s widget rounds to the half star, and the set’s average sits a hundredth of a point below the line where it would draw four and a half stars, and the complaints all point at one product page problem: the listing photographs lids with the wrong containers. Correct the photos and the compatibility note, reply to the existing lid complaints with the fix, and if the next 30 reviews average above about 4.3, they will carry it over the threshold on their own.
The subtraction is just as important. This store had a homepage carousel showing only five star reviews and a “4 stars and up” default filter on product pages. Both come off: the carousel because it presents a curated slice as what customers say, which deserves a legal look under the FTC rule, and the filter because it makes every product look unproven. Total effort, illustratively: about two hours for the audit, a day for photo and copy fixes, and a sampling budget for the knife block. If you are under $500K, run the same audit on your top ten products only. Above $10M, run it per collection, because category norms shift by department.
The best star rating for conversion sits in the mid to high 4s rather than at a perfect 5.0. Northwestern’s Spiegel Research Center found purchase likelihood peaked between 4.2 and 4.5 stars in its 2015 study of 111,460 products, while a 2022 PowerReviews benchmark of more than 20 million product pages found the highest conversion between 4.75 and 4.99. Both found a perfect 5.0 underperformed the band below it. Both datasets come from PowerReviews, so treat the exact peak as direction rather than a target. For most Shopify stores the practical goal is getting products above 4.0 and keeping review volume high enough that the average is stable.
Products with a perfect 5 star rating often sell less because shoppers read the score as unproven or curated rather than as excellent. In most catalogs a perfect average only survives on products with very few reviews, so shoppers learn to connect 5.0 with new or thinly reviewed products. Many shoppers also look for negative reviews on purpose to judge the worst case before buying, and a perfect score gives them nothing to read. PowerReviews has reported that 46% of shoppers are suspicious of perfect 5.0 averages. A 4.7 on hundreds of reviews with a few honest complaints usually reads as more trustworthy.
A product needs enough reviews that one new review cannot swing its displayed rating, which in practice means treating anything under about 20 to 30 reviews as a volume problem. At low counts the average is unstable: ten reviews with three one star ratings displays as 3.8, while the same three complaints among 300 reviews barely move it. Google also requires at least 50 reviews across all your products before your own ratings can show on Shopping ads through its Product Ratings program. Until a product clears that early stage, put your effort into sampling and post purchase review requests rather than into protecting its average.
You cannot hide negative reviews because they are negative if you sell to US customers, since the FTC’s rule on consumer reviews and testimonials, effective October 21, 2024, prohibits suppressing reviews based on sentiment while presenting the rest as your reviews. You can still remove spam, abusive language, personal information, and reviews unrelated to the product. Check your review app for settings that auto-publish only four and five star reviews, homepage carousels that pull only five star reviews, and incentives offered only for positive reviews. This is general information, not legal advice, so check with counsel for your situation.
Fix first the products with meaningful traffic whose average sits just below a display threshold, such as a 4.2 that your review widget draws as four stars instead of four and a half. Export average rating and review count per product from your review app, add conversion rate per product page from Shopify analytics, and sort. Leave strong products in the high 4s alone, treat low review counts as a volume problem, and for products just under a threshold read the low reviews for one repeated complaint. That complaint usually points to a fixable product page or fulfillment issue, which moves the average faster than a review campaign.