
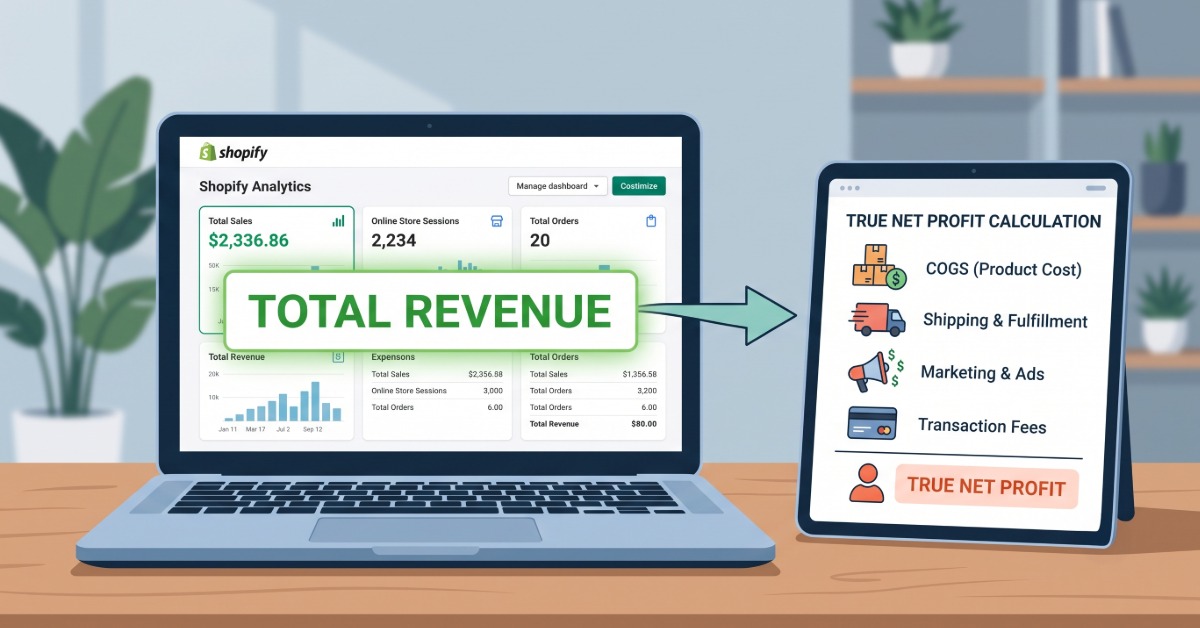
Shopify’s built-in reports are excellent for tracking orders, traffic, and revenue, but they stop at gross figures and cannot show your true net profit, so you need to layer in missing cost data or use a dedicated profit tool to protect your margins.
Revenue is what Shopify shows you; profit is what you actually keep. The gap between those two numbers is where most Shopify stores silently lose money.
Shopify’s built-in reports are powerful for tracking orders, traffic, and revenue. But they have a critical blind spot: they cannot show you your real net profit. Understanding what each report covers, and what it deliberately leaves out, is one of the most important things a Shopify merchant can do to protect their margins.
Shopify gives merchants a detailed suite of analytics right out of the box. You can track sales by channel, monitor traffic sources, analyze customer behavior, and review your store’s financial performance across any time period. For most operational decisions, that is more than enough data.
The problem appears when merchants use Shopify’s reports to answer the question that matters most: how much money is the business actually making? Shopify reports are built around revenue and orders. They do not automatically deduct your cost of goods, your ad spend, your transaction fees, or your refund rate to show what remains after every cost is paid. That gap between revenue and real profit is exactly where most Shopify stores silently lose money.
This guide walks through every major Shopify report category, explains what each one shows and what it misses, and shows you how to bridge the profit gap using a free tool that gives you an instant estimate of your real net margin.
Shopify organizes its analytics into seven report categories, accessible from the Analytics section of the admin panel. Here is what each one includes and where it stops.
Acquisition reports show where your store traffic is coming from, including organic search, paid ads, email, social, and direct visits. Key metrics include sessions by referrer, sessions by location, sessions by social channel, and visitor trends over time. Shopify uses cookies to track visits, so a single visitor can generate multiple sessions if they return after 30 minutes of inactivity or after midnight UTC.
What they miss: acquisition reports show traffic volume and order count by channel but not profit per channel. A Facebook Ads campaign driving 500 orders might be profitable or loss-making depending on what was spent to acquire those customers. Volume without cost context gives an incomplete picture.
Behavior reports show how visitors interact with your store: conversion rates, bounce rates, search queries with no results, sessions by device type, and how product recommendations perform. They are useful for spotting where shoppers drop off in the funnel and which pages or search terms are underperforming.
What they miss: behavior data has no direct connection to profitability. A high-converting product page does not mean that product is profitable to sell. These reports are operational, not financial.
Customer reports segment buyers by new versus returning, location, purchase frequency, and predicted spend tiers. They include cohort analysis, RFM (Recency, Frequency, Monetary) segmentation, and one-time customer tracking, giving a detailed view of who is buying and how often they come back.
What they miss: customer reports do not calculate the real cost of acquiring each customer or their lifetime value after all costs are factored in. Knowing your returning customer rate is useful, but not the same as knowing what you actually earned from those customers net of COGS, fees, and fulfillment.
Finance reports cover payments, refunds, taxes, and payouts. You can see what Shopify Payments transferred to your bank account, what was withheld for refunds, and what tax amounts were collected across any time period.
What they miss: finance reports do not calculate net profit. They reflect revenue minus refunds and taxes, which is closer to a cash figure but still excludes your largest cost categories: COGS, ad spend, and shipping. Two stores with identical finance report numbers can have completely different actual profitability.
Inventory reports track stock levels, product sell-through rates, and days of inventory remaining. They help merchants avoid stockouts on top sellers and identify slow-moving products that are tying up capital.
What they miss: inventory reports are purely operational. They do not connect stock levels to margin. A fast-selling product with poor sourcing economics can still be a margin drain even if the inventory report shows it moving well.
Shopify does include a basic Profit report that subtracts COGS from revenue to show gross profit by product or time period. This is useful as a starting point for understanding which products have the best gross margin.
What they miss: the Profit report only subtracts COGS. It does not deduct ad spend, Shopify transaction fees, shipping costs, refunds, or app costs. Gross profit and net profit are very different numbers, and the gap between them is where most Shopify stores lose money without realizing it.
Because it stops at gross profit, the Profit report cannot track your net profit, and net profit is the only number that reflects your true bottom line after every cost is paid.
Marketing reports show the performance of Shopify-native campaigns, including email, automations, and Shop campaigns. They include ROAS data for Shop campaigns and attribution metrics for emails sent through Shopify.
What they miss: marketing reports only cover Shopify’s own marketing tools. They do not consolidate ad spend and performance data from Facebook, TikTok, Google, or other external platforms. Merchants running multi-channel campaigns cannot see a unified view of marketing cost and return within Shopify’s native analytics.
All of Shopify’s native reports share the same fundamental limitation: they are built around revenue, not profit. This is not a flaw in design. Shopify is a platform, not an accounting tool. But it creates a real operational risk for merchants who use revenue as a proxy for business health.
The costs that Shopify reports do not deduct include:
A store reporting $80,000 in monthly revenue could have $60,000 in combined costs across the items above. The Shopify dashboard shows $80,000. The bank account tells a different story.
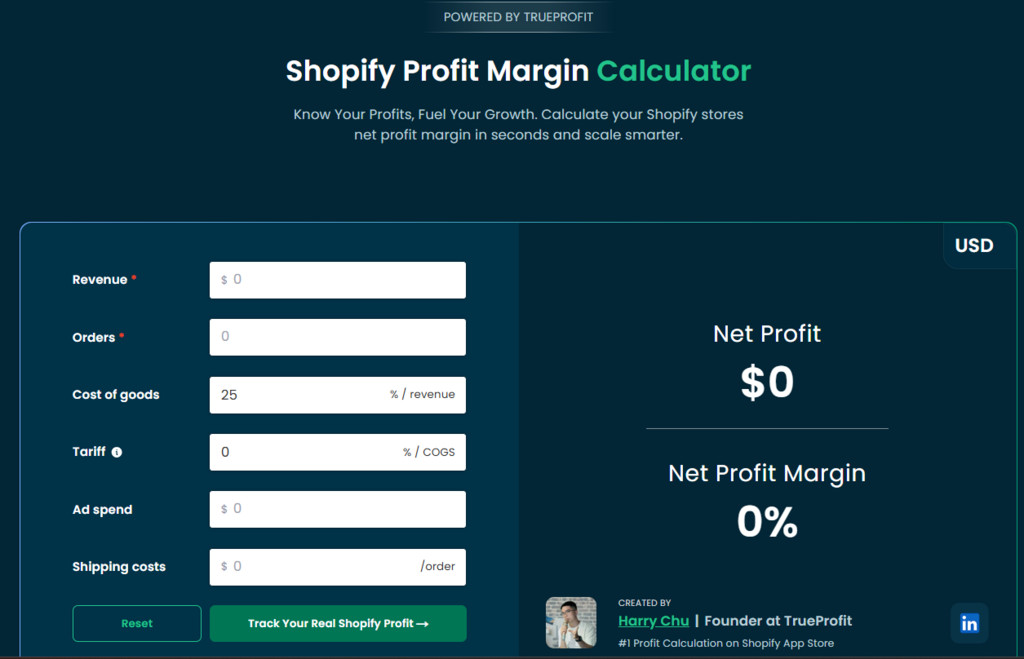
Before going into full analytics automation, merchants can use TrueProfit’s free Shopify profit margin calculator to get an immediate estimate of their store’s net profit and net margin. No account required, no setup, just a few inputs and an instant result.
Here is how to use it:
Input your total store revenue for the period you want to evaluate, whether that is last month, last week, or a custom date range. Pull this number directly from your Shopify sales report for accuracy.
Input the total number of orders for the same period. The calculator uses this to determine per-order cost allocation, particularly for shipping costs that are charged per fulfillment.
Enter your COGS as a percentage of revenue. If you are unsure of the exact figure, estimate based on your average product cost divided by your average selling price. For example, if a product costs $12 to source and sells for $40, your COGS percentage is 30%.
Enter your total ad spend in dollars for the same period, combining all platforms: Facebook, TikTok, Google, and any others you are running. This is typically the second-largest cost after COGS and has the biggest impact on net margin.
Enter your average fulfillment cost per order. If you use a flat-rate carrier, this is straightforward. If costs vary by product or destination, use your average across all orders for the period.
The calculator instantly outputs your net profit in dollars and your net profit margin as a percentage. These two numbers tell you what the business actually earned after accounting for the major cost categories, which is what Shopify’s native reports cannot show you.
Use this as a baseline. If your net margin is below 15%, it is worth reviewing which cost category is the largest drag. If it comes back higher than expected, check whether your COGS and ad spend estimates are accurate before treating it as a definitive figure.
The profit margin calculator is a fast, useful tool for a spot-check on your store’s financial health. But a one-time calculation based on estimated inputs is not the same as accurate, order-level profit tracking in real time. As your store grows, the gap between estimated profit and actual profit widens because edge cases accumulate: variable shipping costs, refund rates that fluctuate, ad campaigns with shifting CPAs, and seasonal COGS changes.
This is where TrueProfit closes the loop. Instead of estimating, TrueProfit connects directly to your Shopify store and all your ad platforms and automatically calculates real net profit on every order, updated live. Every cost is deducted automatically, including transaction fees, shipping, COGS, ad spend, and refunds, so the number on your dashboard reflects what the business actually earned.
Key things TrueProfit shows that Shopify reports cannot:
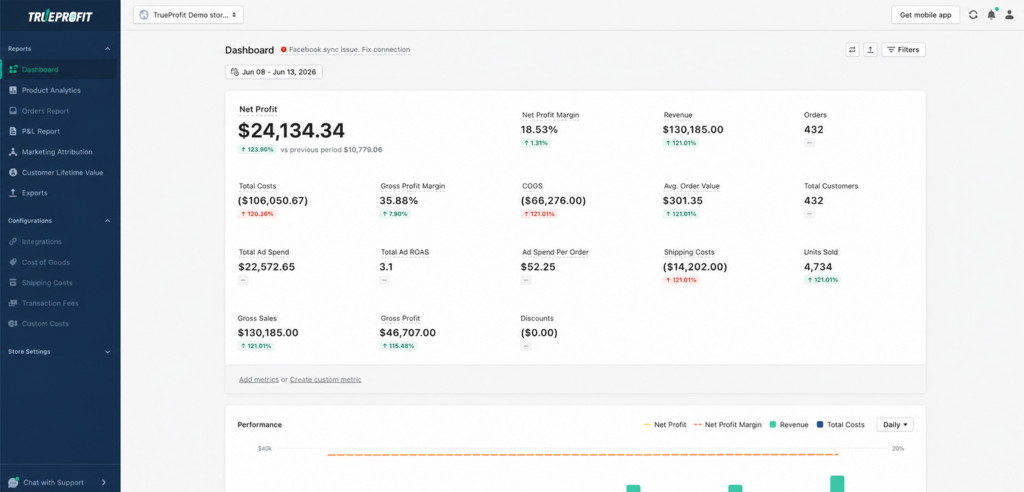
With a 5.0/5 rating from over 770 reviews on the Shopify App Store and a 14-day free trial, TrueProfit is purpose-built to fill the exact gap that Shopify’s native reports leave open.
Shopify’s built-in analytics are a strong foundation for understanding traffic, sales volume, and customer behavior. They are not, and were never designed to be, a complete picture of your store’s financial health. The reports tell you what customers spent. They do not tell you what the business kept.
Use the native reports for what they are good at: diagnosing conversion problems, identifying top-selling products, monitoring traffic channels, and reviewing refund patterns. For the number that actually determines whether the business is working, which is net profit after every cost, supplement Shopify’s reports with a dedicated profit tracking tool and use the free profit margin calculator as a starting point whenever you need a quick read on where your margins stand.
Can Shopify reports show me my net profit?
No. Shopify’s native reports show gross revenue, order volume, refunds, taxes, and payment data. They do not deduct COGS, ad spend, shipping costs, or transaction fees to calculate net profit. For a quick estimate, use TrueProfit’s free Shopify profit margin calculator. For real-time automated tracking, you need a dedicated profit analytics tool like TrueProfit.
Which Shopify report is most useful for financial decisions?
The Finance reports are the closest to a financial view, showing payouts, refunds, and taxes. But even these stop well short of a real P&L. For financial decision-making, they need to be supplemented with COGS data, ad platform spend reports, and per-order shipping costs, either manually or through an automated tool.
How often should I review my Shopify reports?
Sales and acquisition reports are worth checking weekly to catch any sudden drops in traffic or conversion. Finance reports are most useful monthly, aligned with payout cycles. For profit tracking, real-time visibility is better than weekly or monthly reviews, because margin problems compound quickly and the earlier they are caught, the easier they are to fix.
Is there a way to see profit by product in Shopify?
Not natively. Shopify’s product sales report shows revenue and units sold by SKU, but does not deduct COGS or any other cost to show profit by product. Knowing which products are actually profitable after costs requires either a manual calculation per SKU or a tool like TrueProfit that tracks net margin at the product level automatically.
What is a healthy net profit margin for a Shopify store?
This varies by business model. Dropshipping stores typically target 15-25% net margin after all costs. Branded ecommerce and private label stores with higher COGS but lower ad dependency can achieve 20-35%. Digital product stores often see margins above 50% because there is no per-unit production cost. Whatever the target, the starting point is accurately measuring what you are actually earning, which Shopify’s native reports alone cannot do.

