

If you sell on Amazon, you know that Amazon is (shall we say) a unique eCommerce ecosystem.
At baseline, you must play by Amazon’s rules. But to really succeed, you must keep a slew of metrics optimized in order to rank higher than competitors and keep both your customers and Amazon happy.
To keep you successful, we put together this comprehensive guide to cover:
There are dozens of metrics that feed into Amazon’s algorithms that determine how visible your brand is on Amazon.
Some metrics/data points can be found in your Amazon Seller Central dashboard, and others can be found in Amazon reports, which can also be found via Seller Central, which can be accessed via the Seller Central menu:

Understanding the reports, metrics and other data made available by Amazon helps you optimize your product listings, so customers get the best experience possible. Getting comfortable with all of it, though, is a challenge.
To make this data wilderness easier to understand, we’ve categorized the metrics into five main categories (and we’ve explained where to find each in Amazon):
Site performance metrics are the key to success on Amazon because they ultimately affect your revenue, so optimizing them is a must.
Brands spend plenty of time and money working with agencies to improve their Shopify stores’ conversion rates, but Amazon listings require the same level of resources.
There are three crucial site performance metrics for Amazon. These metrics include:
Buy box percentage is arguably the most important metric we will cover in this post.
Buy box percentage determines how often you as a vendor show up as a purchase option for a product.
If you don’t win the buy box, consumers won’t see you as an option, and they probably won’t buy from you.
While Amazon doesn’t make their algorithms public, you can optimize your chances of winning the buy box by offering fast-shipping options, having great product reviews, being responsive to customer queries, and other factors focused on the customer experience.
The more effort you put into optimizing your performance on Amazon, the better your buy box percentage will be, and the more you’ll sell on Amazon.
To find your buy box percentage, do the following:


In the screenshot above, you can see that TULA Skin Care won the buy box (not pictured: the other nine sellers, who lost).
In this case, TULA is most likely to win the sale, but customers can see if the other sellers have more affordable pricing options.
What makes the above example interesting is that this buy box is for a product sold and manufactured by TULA. It makes sense that the manufacturer shows up for their product, right?
Since we’re talking about Amazon, it’s not that simple.
If TULA didn’t deliver a phenomenal customer experience, then one of the other sellers would have shown up instead.
Even if your brand manufactures the products sold on Amazon, you’re not guaranteed to win the buy box for your own products. If wholesalers or other sellers are doing a better job delivering a great customer experience, they can win the buy box for your products.
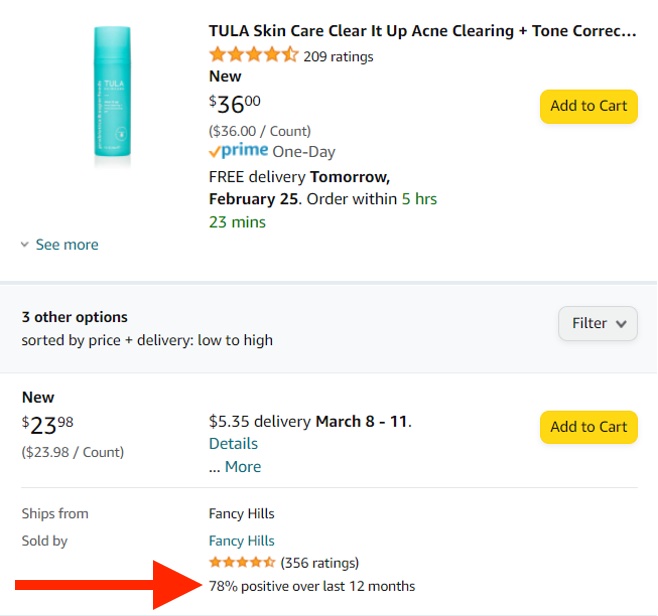
If you look at the other seller options in the screenshot above, you can see that even though TULA’s seller option is $36 compared to the $23.98 from the other seller, TULA still won the buy box.
TULA won the buy box for a few reasons. They are definitely maintaining appropriate inventory levels and are highly responsive to customers (more on these factors below), but it’s crucial to note that the other seller’s positive feedback is only 78%.
By Amazon standards, 78% is a terrible positive feedback rate (you want to be at 95% at the absolute minimum). So even though TULA’s seller option is $12 more, they still won the buy box.
Product ranking is the second-most important metric to track and optimize on Amazon after buy box percentage.
People go to Amazon because they have something in mind they want to buy. If your product is one of the first few to show up in their search query, then your sales will increase.
Think of it like SEO success.
If you show up on the first page of Google, you “win.” In the same way, if you show up in the top few spots in Amazon, you have a much higher chance of selling.
Conveniently, Amazon’s reports show your product rankings. Your rank is updated hourly, so you can see how you’re performing in near real-time. To optimize your product ranking, you’ll effectively need to focus on search engine optimization for Amazon (aka Amazon SEO).
We’ll cover Amazon SEO in-depth in the future. For now, you can improve product rankings by optimizing your product pages with relevant keywords, high-scoring reviews, and offering fast-shipping options.
With Amazon’s recent focus on showing more Sponsored Listings (i.e., one of the kinds of Amazon ads), it’s in your best interest to work on getting a better product ranking. Showing up organically is a significant boost to your sales performance and can make or break your success on Amazon.

In the photo above, the first two listings are sponsored, and the third listing is organic. This means that the third brand has the highest product ranking, which ensures that they won’t have to pay for ad space and that they’ll have better margins.
Unit Session Percentage Rate is Amazon’s version of conversion rate.
It’s a simple metric, but it’s vital to success. A high conversion rate means you have a product that’s in high demand. A low conversion rate means you need to focus on getting better reviews, new product images, and exploring different pricing options.
Amazon won’t suspend you as a seller if your conversion rates are low, but it factors into the product ranking algorithm.
Since your business is selling on Amazon’s marketplace, there are tons of fees to account for, including:
These fees add up over time and can hamper margins. Sellers need to dig into the different fees to understand the economics on a product level–certain products could end up being quite profitable and other products quite unprofitable.
Additionally, fees have a significant
FBA gets you the Prime Badge, fast shipping options and better conversion rates, but the fees might be higher than fulfilling orders yourself.
If your brand can offer 2-day shipping comparable to Amazon Prime, then FBM could be a great way to grow your brand on Amazon while not dealing with FBA fees. If you’re able to consistently meet Amazon’s shipping expectations, you could become eligible for Seller-Fulfilled Prime, which gives you the Prime Badge to help improve ranking and conversion rates.
Selling on Amazon has its own set of fees on an individual sales basis (e.g. referral fees). Many other fees fall under the FBA category, which Amazon details on this page; these can all be found in business reports in Amazon Seller Central.
Customer satisfaction is the name of the game at Amazon.
Amazon knows that a great customer experience ensures customers keep coming back. And Amazon won’t hesitate to heavily penalize or suspend you as a seller if you’re consistently delivering a negative customer experience.
The occasional negative experience is understandable and forgiven, but the customer always comes first for Amazon.
For sellers on Amazon, we recommend optimizing the two customer experience metrics below:
ODR is the number of Amazon customers who had a negative experience with your brand.
According to Amazon, an order is defective if:
From a customer’s point of view, if they see lots of 1- and 2-star reviews for your products, then they’re less likely to purchase from you. To Amazon, though, a high order defect rate signals that your brand might need to be suspended from selling on the marketplace since you don’t meet their quality standards.
Amazon requires you to have an order defect rate of less than 1%. With that in mind, monitoring your ODR is vital for ensuring customers are happy and ensuring you’re in good standing with Amazon as a seller.
Order defect rate is calculated monthly so that customer claims can be processed and to give you a chance to rectify negative reviews.
If you hit the 1% benchmark, you have a very brief window of opportunity to improve your ODR for future orders.
The easiest way to ensure your order defect rate is continuously below 1% is to make sure you provide outstanding customer service, ship on time, and deliver quality goods.
You can view your ODR in the seller dashboard by doing the following:

Are you responsive to customers’ messages? You should be. Contact response time is a metric that measures the number of messages you’ve replied to within 24 hours, including weekends and holidays.
If you’re slow to respond, this negatively affects your contact response time. And take note that auto-responders don’t count as a response. A human must write the email and respond to the customer.
A slow contact response time means you’re less likely to show up in searches, as Amazon doesn’t want to promote sellers who are slow to respond to customers.

Most sellers on Amazon use FBA because it’s convenient, the fees are largely manageable, and it includes the Prime Badge, which boosts conversion rates (or, should we say, Unit Session Percentage rates).
Plus, sellers don’t have the fulfillment network of Amazon, so it’s harder and much costlier to offer 2-day shipping on your own.
If you do use FBA, it’s important to understand how your inventory is performing when it’s stored in Amazon’s warehouses.
There are a few reports focused on inventory in Amazon’s FBA reports, but the two reports we recommend focusing on are:
Recommend removal is exactly what it sounds like: these are the inventory items that Amazon recommends you have removed from their inventory unless you want to pay an additional long-term storage fee (LTSF).
Amazon doesn’t want products to stay on its shelves for too long, so this report lets you understand which products aren’t selling so that you can determine how to sell them faster.
Use this report to ensure you don’t send any more of the recommended removal products to Amazon unless you can find a way to improve sales velocity for those specific products.
This report can be found in the FBA reports section of the seller dashboard:


Inbound performance is a useful report because it provides a detailed breakdown of any potential issues Amazon has when trying to receive your inventory.
At its core, FBA is a third-party logistics (3PL) service, so it’s vital that Amazon doesn’t have issues when trying to store your products.
You can use this report to determine the root cause of any receiving issues. Once you’ve identified the issues, you can work with Amazon to improve the receiving process and ensure Amazon always has your inventory in stock.
This report can be found in your FBA reports, accessible through your seller central dashboard:

Amazon normalized 2-day shipping, and they’re working hard on making same-day and 1-day shipping into the new normal: faster shipping means more sales.
Amazon wants merchants that can keep up with customer demand and their need for fast shipping. If you’re doing FBA, then you don’t need to worry about much. As long as you’re staying on top of delivering inventory to Amazon, then you’re set.
But if you’re not letting Amazon handle shipping, and you choose the FBM route, there are a few metrics to focus on, as Amazon wants to ensure orders are getting delivered on time.
Pre-fulfillment cancellation rate is calculated as the number of cancellations (prior to shipment) divided by the number of orders per week. This metric must stay below 2.5% to remain in good standing with Amazon. If your cancellation rate rises above 2.5%, Amazon may deactivate your account.
This metric counts every single order. Keep your inventory well-stocked and plan in advance for busy shopping periods like the end-of-year holiday shopping season or other major holidays, like Valentine’s Day.
To view your cancellation rate, do the following:

If a customer is told their order is going to be delivered in two days, then they expect the product to arrive in two days. To add even more pressure, Amazon considers any order fulfilled after three or more days to be late.
Fast shipping is a must.
If your late shipment rate reaches 4%, you can expect to hear from Amazon that you’re not meeting their expectations and that they’re keeping an eye on you. If this happens, it’s crunch time: you need to do what you can to improve your fulfillment operations so that orders are shipped on time.
If you are having trouble maintaining a low LSR after working on your operations, it might be worth considering if FBA might be a more sustainable option for your brand.
If you can’t meet customer demands and Amazon’s requirements, the choice becomes an either/or: “Do we lose Amazon as a channel, or do we go with FBA?”
You can view your late shipment rate by doing the following in your Amazon Seller dashboard:

One of the downsides of Amazon is you have zero personal interaction with the customer. Customers belong to Amazon, and you need to communicate with customers through Amazon through their anonymized email system:

So how do you make use of limited data to ensure you can improve the customer experience as you do with your own website?
Unlike managing your own website on an eCommerce platform, you can’t modify the design of Amazon’s listings. But knowing how to optimize the content in the listings with the customer in mind is the key.
At Daasity, we work with thousands of brands selling on Amazon and Shopify and create a single source of truth around that data.
Doing it all manually, to be technical, sucks. As a result, it probably sounds pretty darn good to have all your Amazon data completely automated and beautifully presented for you to analyze.
Don’t do it all by yourself; let Daasity do all the heavy lifting.
Build a single source of truth around your Amazon data today. Check us out here and learn more.

