
The Conversion
The Very Presence of UGC Has a Positive
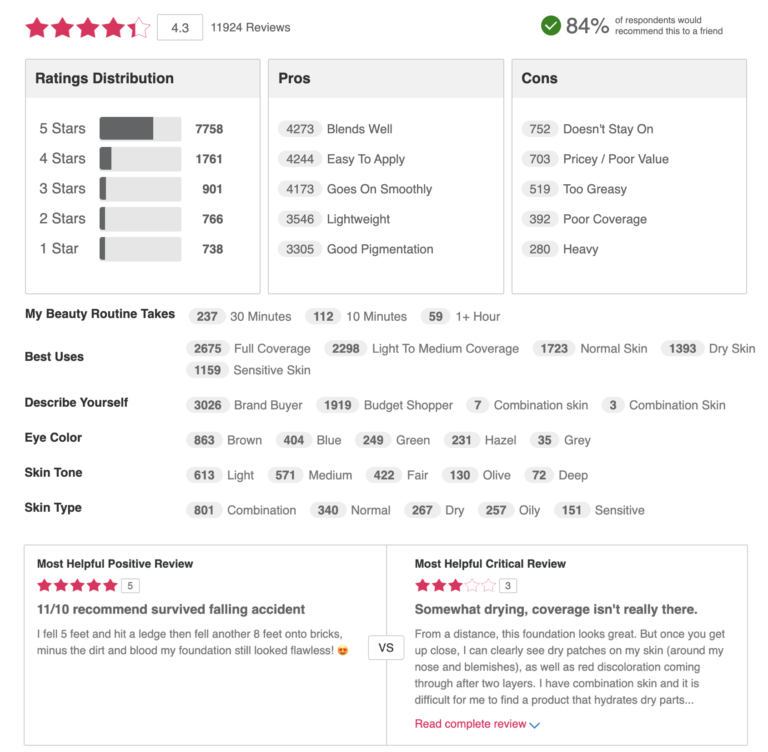
Reviews Double Conversion
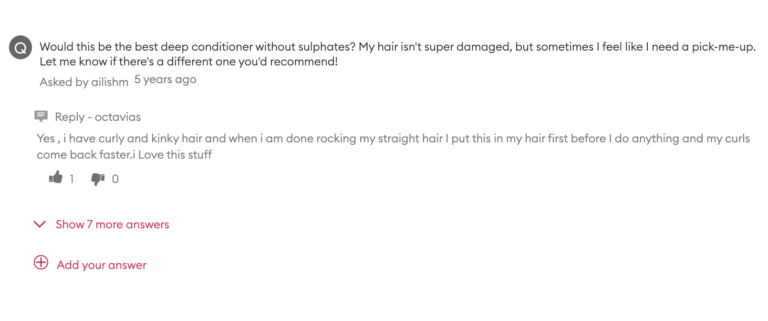
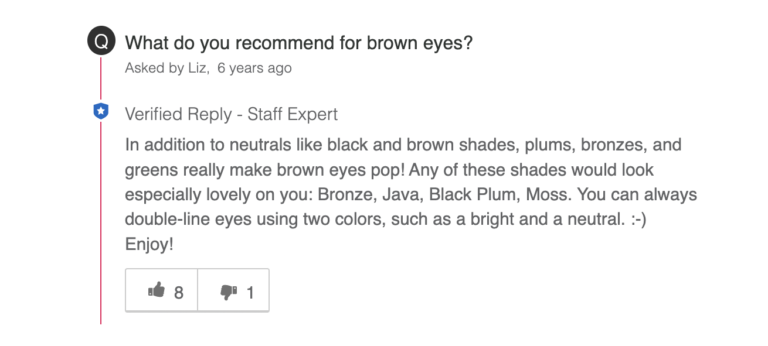
Q&A Remains the Most Powerful Form of UGC – and Its
User-Generated Imagery Strongly Impacts Conversion
Find What Works for Your Business
When consumers are researching products and services, they’re no longer satisfied to hear from the brands and retailers that sell them. Instead, they want to hear from the real experts: those who have purchased and used the product or service in question.
In fact, user-generated content usually generate conversion with content, including ratings & reviews, questions & answers, and visual content has become an essential component of the shopping journey for modern consumers. If there’s any doubt in your mind, consider these statistics:
0%
of consumers read reviews when shopping online at least sometimes
0%
of consumers read Q&A at least occasionally; 68% have submitted their own questions
0%
of consumers regularly or always seek out visual content from other consumers prior to making a purchase
Collecting and displaying user-generated content is an important way to meet shoppers’ expectations. However, before investing in UGC, brands and retailers (understandably) want to know what’s in it for them. In other words, how does the presence of this content
Now, we have a definitive answer.
We analyzed activity on over 1,200 brand and retailer sites over the course of 2021 to pinpoint the conversion
Of course, each UGC display is different. While a visually appealing, on-brand UGC display is typically a priority for many, the ultimate aim must be to create a display that has the greatest conversion
While understanding how UGC elements
Ultimately, you’ve got to determine what works best for your business.
Start with best practices, and test new features and functionality that are shown to
This report is based on an analysis of 1.5MM online product pages from over 1,200 brand and retailer sites over the course of 2022. Here is a key of terminology to refer back to when reading the report:
This data was pulled for the period from January 1, 2021 to December 31, 2021.
Activity on more than 1.5 million product detail pages across 1,200 ecommerce websites. These websites run the gamut of ecommerce categories.
The visitor conversion metric, used as the baseline for this report, is calculated based on conversions from individual visitors within a 24 hour period. A new visitor session starts every 24 hours, with all accompanying downstream implications on the conversion metric.
Ecommerce UGC page visitor overall
Calculated for any consumer visiting a product detail page that runs PowerReviews UGC display analytics technology.
Calculated based on unique visitors who have scrolled a product page enough to be served an impression of at least one type of UGC (review, Q&A, or imagery). The review snippet (the UGC element used at the top of PDPs to display a summary of the average star rating, number of reviews, etc.) is excluded from the UGC impression metric. Throughout this report, we use this metric to more closely examine the different types of UGC – specifically reviews, Q&A, videos and imagery.
A metric calculated based on visitors who interact with UGC. Some examples of UGC interactions include clicking “read more” on a review, opening a user-submitted photo, or using the search box to run a search within review content.
During 2021, there was a 2.8% conversion rate on the 1,200 sites we analyzed that run PowerReviews’ UGC technology.
This may be slightly higher than benchmarks you’ve seen from other sources. There are a couple reasons for this variance.
When a visitor scrolls to a point where they see some form of UGC, they’re more likely to convert. In fact, there’s an 8.5% lift in conversion when a visitor is served up some form of UGC. In comparison, UGC impressions resulted in a 4.3% lift in conversion in 2020.
When site visitors actually interact with UGC, the
We’ll dive deeper into how consumers interact with UGC throughout this report.
How UGC Impacts Conversion
Ecommerce UGC Page Visitor Overall Conversion Rate
UGC Impression Conversion Rate
4.3% conversion lift from UGC Impression
UGC Interaction Conversion Rate
108.4% conversion lift from UGC Interaction
Ecommerce UGC Page Visitor Overall Conversion Rate
UGC Impression Conversion Rate
8.5% conversion lift from UGC Impression
UGC Interaction Conversion Rate
100.6% conversion lift from UGC Interaction
By simply displaying UGC (including reviews, Q&A and visual content) you can experience a notable lift in conversion. However, UGC interactions drive an even larger
It’s no secret that a growing portion of consumers are shopping online – a trend that is unlikely to slow down. Statista forecasts that ecommerce will make up nearly a quarter of total retail sales worldwide by 2025.
While online shopping is convenient, it also involves a level of risk. That’s because it’s impossible to know for certain that a product will fit one’s needs – especially without seeing it in person first.
Reviews can help shoppers overcome this risk and increase their likelihood of making a purchase. There’s a 108.3% lift in conversion among visitors who interact with reviews.
The
Lift in conversion when visitors interact with reviews
How Various Review Features
The conversion lift for visitors who engaged with each ratings and reviews feature, compared to the standard conversion rate for the same pages
While some reviews are helpful when a shopper is making a purchase decision, others simply aren’t. A visitor can indicate if a given review is helpful (or not) by clicking on the thumbs up or thumbs down icon.
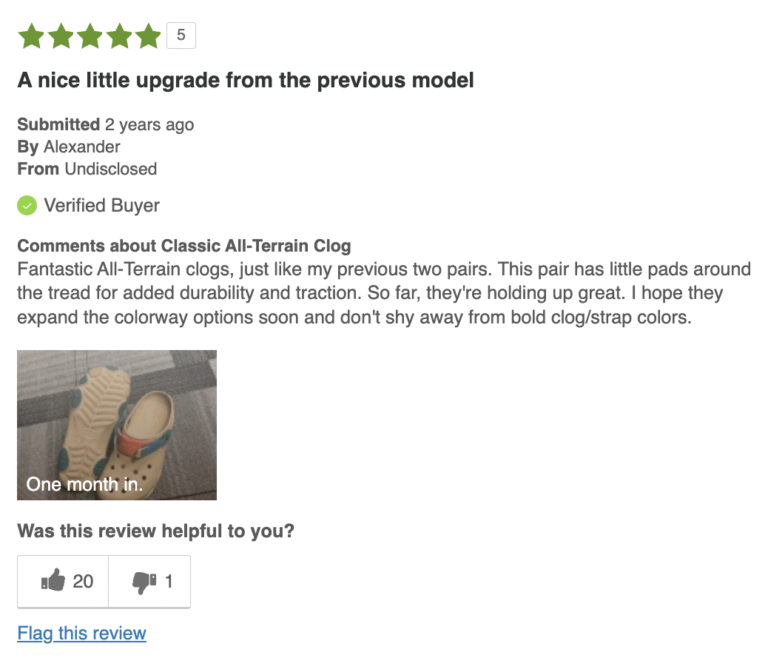
Helpful voting is the review interaction that impacts conversion most. There’s a 414.3% lift in conversion among visitors who click the thumbs up icon. In comparison, there was a 314.7% lift in conversion as a result of this interaction in 2020.
Interestingly, there’s also a large conversion lift – 292.9% – among visitors who click the thumbs down icon on a review. While a specific review might not be particularly helpful, it doesn’t necessarily deter a shopper altogether.
Typically, a consumer doesn’t read every single review for a given product. Instead, they seek out content that’s relevant to them. One way they can do this is by typing a search term into the review search box.
There’s a 260.7% lift in conversion among visitors who interact with the review search feature, up from 202.9% among those who took this action in 2020.
Once a visitor has scrolled to the bottom of a review display, they have the opportunity to take a few different actions. They can go to the next page of reviews, return to the previous page, or return to the top.
Here’s a snapshot of how these footer actions
How Footer Actions
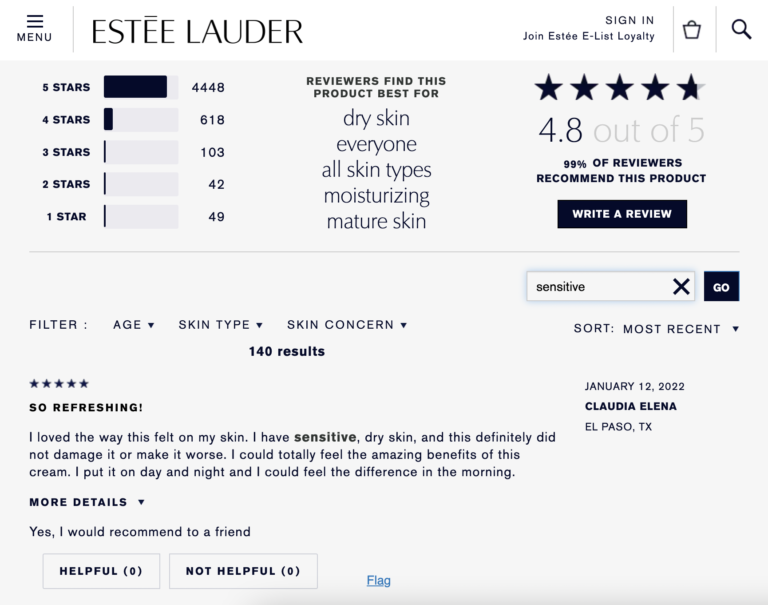
It’s considered a best practice to display a review overview (also known as a snippet) at the top of product pages. The snippet provides a high level overview of the review content for a product and typically includes information such as the average star rating and the number of reviews available for the product.
If a visitor clicks on the snippet, they’re taken to the full review display, where they can read individual reviews, as well as sort and filter content to find what’s most relevant to them. There’s a 164.3% conversion lift among consumers who click the review snippet, up from a 129.4% lift in 2020.
Some brands and retailers display a product’s most liked positive review alongside its most liked negative review one. This is referred to as a review faceoff, and it’s a great way for shoppers to quickly determine the best case and worst case scenarios of a given product.
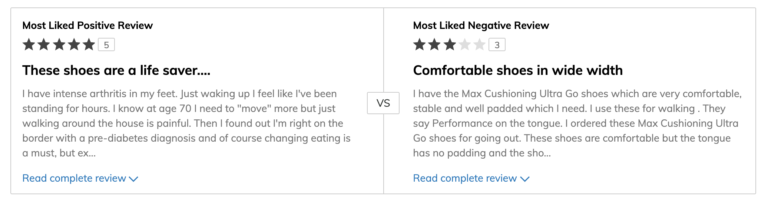
There’s a 128.6% lift in conversion when shoppers click to read the entire positive review that’s featured in the snapshot.
What’s perhaps more interesting is that there’s a 114.3% lift among shoppers who click to read the entire negative review. This is proof that negative reviews don’t necessarily deter shoppers. Instead, this content allows consumers to understand the worst case scenario of a given product. If it’s something they can live with (or that simply isn’t relevant to them), they’re still likely to move forward with the purchase.
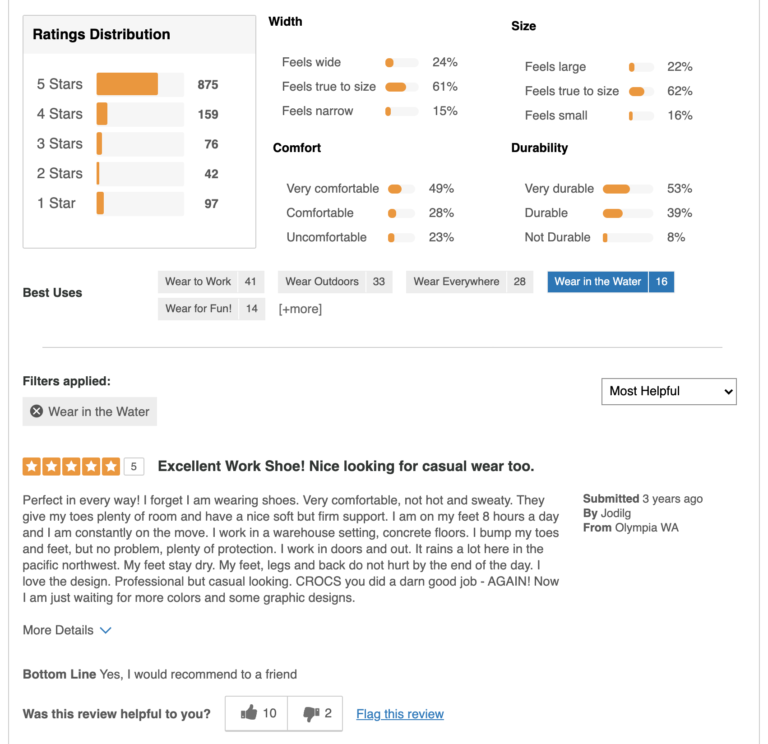
The best review displays allow visitors to easily sort reviews to surface what matters most to them. For example, a visitor might sort content based on recency, helpfulness, or the availability of visual content.
There is a 114.3% lift in conversion among shoppers who click to sort reviews. This is up slightly from 2020, when there was a 109.7% conversion lift for this type of interaction.
Here’s a closer look at how different types of sorting behavior
Conversion Lift by Type of Review Sorting Behavior
Many brands and retailers include a feature in their review display that allows shoppers to see how many reviews were written for each star rating. Shoppers can then click on a specific star rating – and just the content submitted with that particular rating will be displayed.
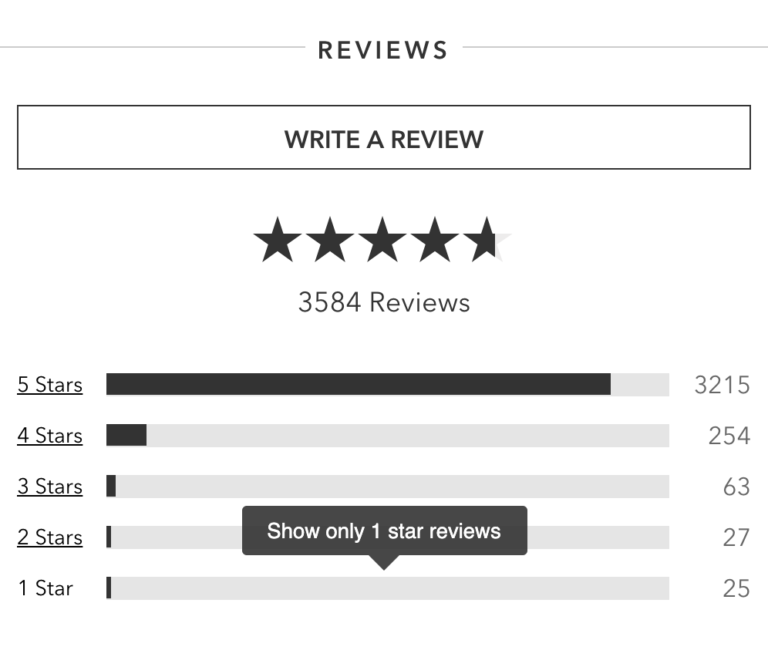
There’s a 89.3% lift among shoppers who click to filter by star rating.
Let’s zoom in further to see how many visitors filter reviews by each star rating – and how it impacts conversion.
Conversion Lift by Type of Review Sorting Behavior
Note: Star interactors typically filter by more than one rating.
The most common way to filter by star rating is to see only one-star content. This isn’t surprising, as previous research found that 96% of consumers specifically seek out negative reviews – with over half (52%) explicitly looking for one-star content.
What is surprising is that those who filter to see one-star content still convert at a rate that’s much higher than average. In fact, there’s a 85.7% lift in conversion among those who filter to see one-star reviews. Again, this is proof that the presence of negative reviews isn’t enough to deter many consumers. Rather, negative reviews are a tool that consumers depend on to make more informed purchase decisions.
Some brands and retailers ask those writing reviews to select “tags” related to the product. These might include pros, cons and best uses of a product – among others.
These brands and retailers then allow future shoppers to filter reviews by these specific “tags.”
Visitors who filter reviews by tags convert at a rate that’s 78.6% higher than average. This is up significantly from 2020, when there was a 35.3% conversion lift among visitors who filtered reviews by tags.
When a visitor is reading a review, sometimes they have the opportunity to expand it to get additional details about the shopper that wrote the review and their experience with the product.
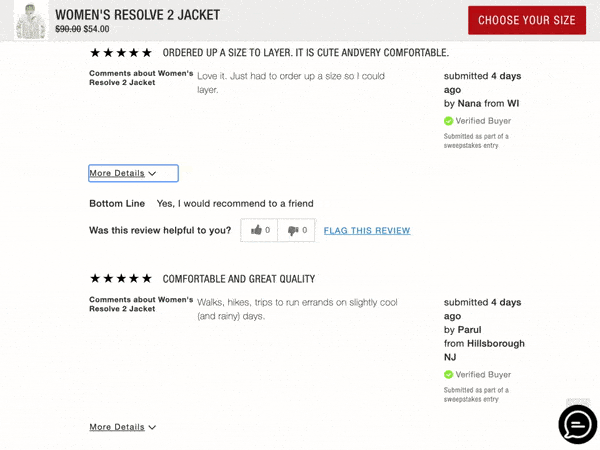
There’s a 50% lift in conversion among shoppers who click to expand a given review to read more details.
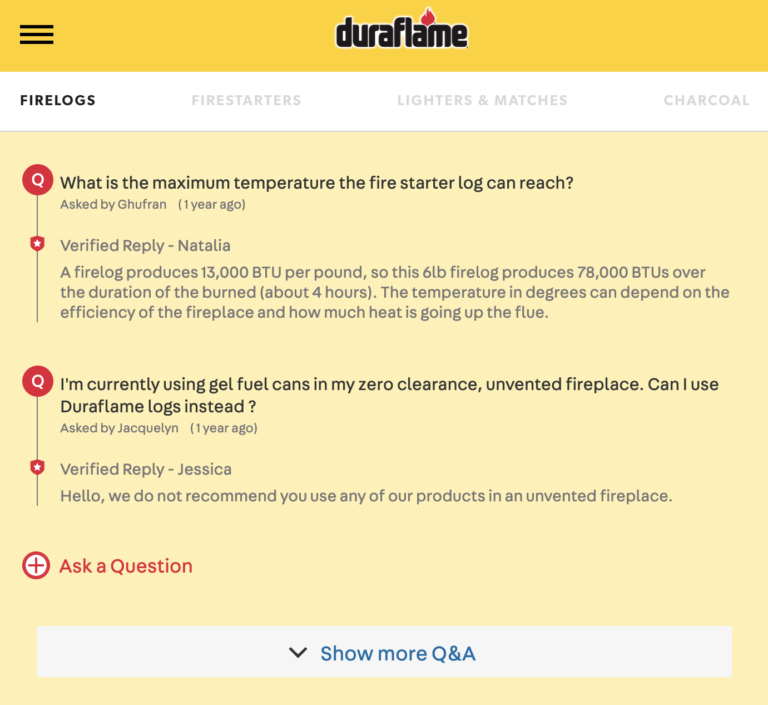
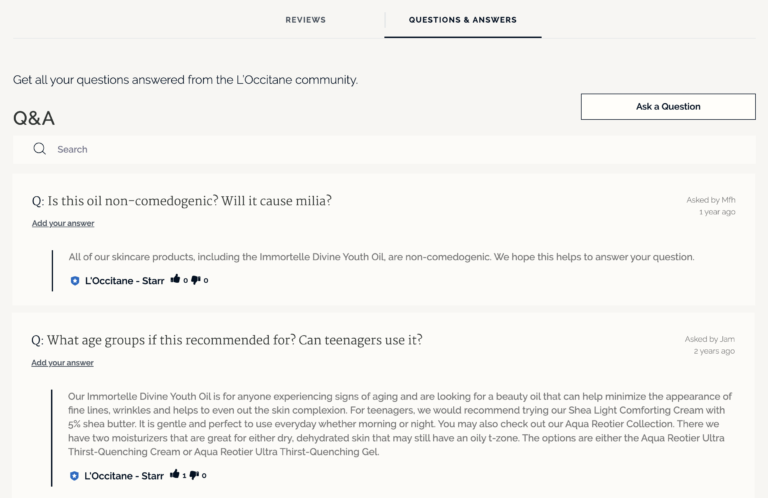
When a consumer is shopping in a store, they can reach out to a sales associate to ask questions and get product recommendations. That’s not possible for online shoppers.
Instead, many of these consumers scroll the product page to find the questions and answers (Q&A) portion of the page. There, they can see if other shoppers have already submitted similar questions – and gotten answers. If not, they can submit their own.
When we analyzed 2020 data, we found that of the types of UGC, Q&A had the largest
This continues to be the case. In fact, the
Impact of Q&A on Conversion
Lift in conversion when visitors interact with Q&A
A typical Q&A display includes various features and functionality. Let’s examine how interacting with key features impacts purchase behavior.
How Key Q&A Features
Conversion lift among visitors who engaged with each Q&A feature
On a typical product page, a set number of questions and answers appear. If there is more Q&A than what is initially displayed, the shopper can click on text that reads “Show more Q&A” to access it.
If a shopper seeks out additional Q&A beyond the content that’s initially displayed, it’s clear they’re interested in learning a lot about a given product. They’re also more likely to convert. In fact, there’s a 217.9% lift in conversion among shoppers who click “Show more Q&A.” This is up significantly year-over-year. In 2020, there was a 164.7% conversion lift when shoppers clicked to show more Q&A.
By default, a single answer is usually displayed for a given question submitted via Q&A. However, there are instances when there might be multiple responses to a single question. For example, a question might have an official response from the brand, as well as from someone who purchased the product. The visitor can click “show more answers” to see any additional responses.
There’s a conversion lift of 192.9% among visitors who click to show more answers. In 2020, the lift for this action was 158.8%
If a shopper finds a response to a previous customer’s question to be particularly helpful, they might opt to tap or click the thumbs up icon.
Those who click the helpful icon convert at a rate that’s 192.9% higher than average. This is up significantly from 2020, when there was a 141.2% lift in conversion among visitors who took this action.
Our previous research found that 94% of shoppers value answers to Q&A that are posted by verified buyers who have already purchased the product in question. So it’s not surprising that a growing number of brands and retailers allow different experts to post answers to Q&A – including existing customers.
A site visitor can post an answer to an existing question by clicking on the text that says “add your answer.”
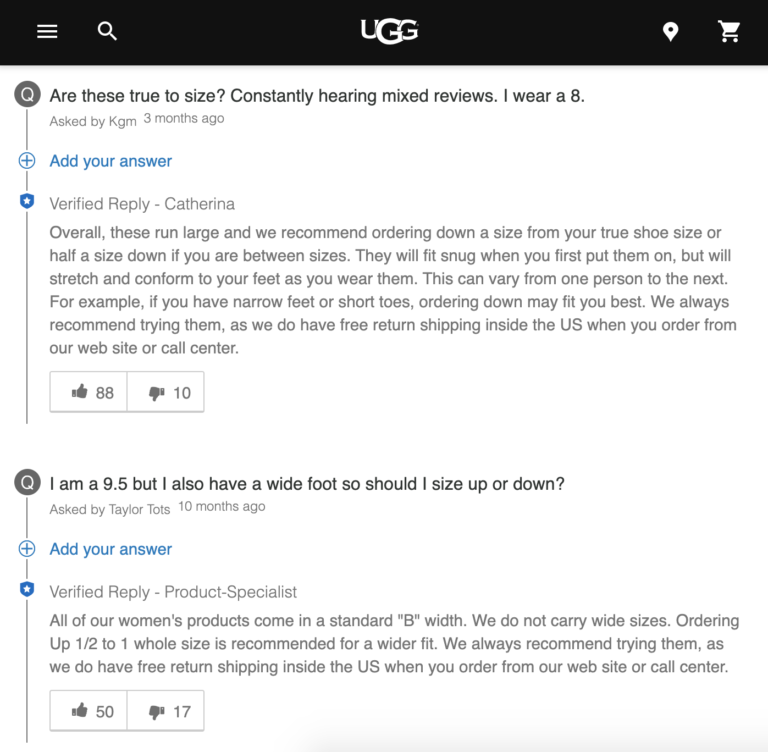
There’s a 150% lift in conversion among visitors who take this action. This is up significantly from 2020, when there was a 111.8% lift in conversion among visitors who clicked “add your answer.”
On some brand and retailer sites, shoppers see an overview – or “snippet” – at the top of product pages. This snippet provides shoppers with a high-level overview of the UGC available for that particular item, and it may include a link a visitor can click to submit their own question.
Visitors who click on “Ask a Question” in the UGC snippet convert at a rate that’s 139.3% higher than average. This is up slightly from a 137.1% lift in conversion among visitors who took this action in 2020.
Visitors can also submit questions by clicking or tapping the “Add a Question” button that’s part of the Q&A header.
In 2021, there was a 100% increase in conversion among visitors who clicked “Add a Question” from the Q&A header, compared to a 79.4% lift among those who took the same action in 2020.
During 2021, the overall conversion rate across the brand and retailer sites we analyzed was 2.8%. However, that rate is significantly higher among visitors who interact with user-generated photos and videos on a product page: 5.9%. That’s a huge 106.3% lift in conversion.
How Interactions with User-Generated Visual Content
Lift in conversion when visitors interact with user-generated imagery
User-generated visual content continues to have an increasingly large
There’s no denying that those who interact with photos and videos submitted by other consumers are a lot more likely to make a purchase Now, let’s explore how different types of visual content interactions
Once you’ve started to collect photos and videos from your shoppers, it’s a best practice to showcase it in a visual content gallery on the appropriate product page. Our analysis found there’s a 110.7% conversion lift among shoppers who click on any image within such a gallery – up from a 94.1% lift in 2020.

Once a visitor has clicked on an image or video in an imagery gallery to enlarge it, they typically have the option to navigate to other imagery by clicking on the forward and back arrows.
There’s a 103.6% lift in conversion among visitors who click to see the next image. The conversion lift is 96.4% among those who click the arrow to view the previous image.
Notably, both forward and back navigation in the image gallery had a larger
The
Here are our 5 key takeaways from our latest analysis.
The Very Presence of UGC Impacts Conversion
If a shopper scrolls a product page long enough to be served up some form of UGC, there’s a 8.5% lift in conversion. The
UGC is no longer optional. It’s essential for any brand or retailer looking to grow sales in an increasingly competitive market. If you’re not already collecting and displaying this content, you’re leaving money on the table.
Reviews Fuel Confident Purchase Decisions
There’s risk involved with purchasing a product online, sight unseen. However, reviews can help shoppers overcome this risk – and increase the likelihood they’ll make a purchase. In fact, there’s a 108.3% lift in conversion among shoppers who interact with reviews on product pages.
Start collecting reviews. And prominently showcase this content so it’s easy to find and consume, whether a shopper is using a computer or their mobile device. In addition, consider adding features and functionality to your review display that make it easy for your shoppers to sift through content to find the reviews that are most relevant to them.
Q&A is (Still) the Most Impactful Type of UGC on Conversion
Online shoppers don’t have the opportunity to ask questions and get recommendations from an in-store associate. Instead, many turn to the Q&A portion of a product page to read questions that have already been submitted – and pose their own.
There’s a 194.2% lift in conversion when shoppers interact with Q&A content, making it the type of UGC that has the largest conversion
It’s essential to provide online shoppers with a means to get answers to outstanding questions. Add a Q&A section to your product pages, and be sure to equip it with plenty of features that make it easy for shoppers to sift through existing questions – and ask their own.
User-Generated Visual Content is No Longer Optional
A growing number of consumers specifically seek out visual content from other shoppers before making a purchase. And this content has a large (and growing)
If you’re not already, start collecting photos and videos from your shoppers, both natively and via Instagram. Then, showcase it in a visual content gallery on your product pages that’s easy to find and navigate.
Ongoing Measurement and Optimization is Key to Maximizing the Potential of Ratings & Review Programs
Throughout this report, we’ve explored the features of UGC that have the largest
As such, it’s essential to continuously measure the performance of your UGC program. Your UGC partner should make it easy to determine which UGC features are driving conversion – and which aren’t. You can use those insights to make impactful changes to your display that’ll help you drive an even larger lift in conversion – and help you grow your sales and market share.

