Turn followers into customers
TikTok analytics shows you how your videos perform, who watches them, and what drives sales. When it comes to running a print-on-demand business on TikTok Shop, the sellers who track the right TikTok metrics grow faster, waste less content effort, and spot trends before they peak.
This guide covers everything from built-in TikTok data to third-party tools so you can turn your TikTok analytics data into smarter content decisions.
TikTok analytics is a built-in toolset that tracks how your content performs across reach, engagement, retention, and conversions. It helps creators, small businesses, and eCommerce brands understand what drives follower growth, which videos resonate with viewers most, and where to improve.
Available for both Creator and Business accounts, TikTok analytics measures key performance indicators such as:
All data is filtered by a selected date range, so you can track performance week over week or compare marketing campaigns.
Instead of posting and hoping, you identify exactly which content performs, when your audience engages, and which individual videos drive TikTok Shop orders.

You can access TikTok analytics directly from the TikTok app, but you’ll need a Creator or Business account. Once that’s set up, follow these steps to see your analytics.
From here, you’ll see four main sections:
TikTok analytics lets you filter results by date range, so you can compare TikTok performance across specific time windows. To dig deeper into conversion metrics, link your TikTok Business Suite or use TikTok Ads Manager for more detailed reporting.
Analytics data can show a 24–48 hour delay. Use a rolling seven-day or 28-day window for the most reliable trends.
The Shop Performance Score (SPS) is a dynamic 0–5 rating that TikTok calculates based on six key metrics across product satisfaction, fulfillment, and customer service. Sellers automatically receive an SPS after delivering 30+ orders in the past 90 days.
In TikTok Seller Center, navigate to Account Health to view your current SPS and the individual metrics driving it.
| Metric | What it tracks |
|---|---|
| Negative review rate | Percentage of orders receiving poor ratings |
| Non-buyer fault return rate | Returns caused by product or fulfillment issues |
| Seller fault cancellation rate | Orders canceled due to seller error |
| On-time delivery rate | Orders delivered within the promised window |
| IM dissatisfaction rate | Unresolved or poorly handled customer messages |
| After-sales handling time | Speed of resolving post-purchase issues |
A high SPS score directly affects your TikTok presence and revenue:
For POD sellers, the fastest way to protect SPS is to choose products from the TikTok-approved Catalog, as they meet platform compliance standards and can be fulfilled within TikTok’s strict timelines.

TikTok analytics data is grouped into five categories:
| Category | What it measures |
|---|---|
| Reach | How many people saw your content, and where they found it |
| Engagement | How viewers interacted – likes, comments, and shares |
| Retention | How long people watched and whether they finished the video |
| Audience | Who your viewers are and when they stay active |
| Conversions | Actions that lead to sales or TikTok Shop orders |
POD sellers need to track metrics across three areas: content quality, sales performance, and audience growth. Use these benchmarks as baselines, but not as ceilings. Numbers vary by niche, product type, and posting volume, but consistent underperformance against these figures signals a specific problem worth diagnosing.
| Metric | Benchmark |
|---|---|
| Watch time | 30–50%+ of video length |
| Video completion rate | 20–40%+ |
| Engagement rate | 3–8%+ |
| Metric | Benchmark |
|---|---|
| Conversion rate | 1–5%+ |
| Cost per acquisition (CPA) | Track if running ads |
| Revenue per 1,000 views | Key scaling metric |
| Metric | Benchmark |
|---|---|
| New followers per viral video | Track per post |
| Repeat buyers | Long-term retention signal |
This category matters most for TikTok Shop sellers. Views only convert to revenue when the right metrics align.
TikTok Shop-specific metrics to track:

TikTok’s dashboard covers the essentials, but many sellers and businesses use third-party tools to access historical data, run automated reports, and compare performance across social platforms.
Below are four TikTok analytics tools worth looking into.
An AI-powered analytics tool built for TikTok and Instagram, Analisa.io tracks historical data and performance trends for any public TikTok profile, measures hashtag performance and follower growth over time, and supports competitive benchmarking and influencer audits.
A strong choice for sellers who want to analyze competitor accounts or assess potential affiliates before reaching out to them.
Built specifically for TikTok data analysis, Exolyt lets you analyze your own account, monitor competitors, surface trending content and top-viewer-count data, and visualize TikTok campaigns over a custom date range.
The platform’s cross-account comparison makes it useful for tracking how your TikTok performance stacks up against competitors in the same niche.
A social media management tool with TikTok analytics support across multiple platforms.
Socialinsider tracks engagement data, reach, and CTR across TikTok, Instagram, Facebook, and LinkedIn. Automated reports and cross-platform data tracking make it a practical choice for sellers managing multiple social platforms or working with a team.
A lightweight visual analytics tool for tracking individual posts and video performance. Popsters supports quick comparisons by format, hashtag, and posting time. Useful for creators who want clean, visual analytics data without a steep learning curve.
Third-party analytics tools typically unlock deeper audience insights, downloadable automated reports, and historical data that TikTok’s native dashboard does not retain long-term. That’s particularly useful when running ads or tracking ROI across campaigns.

TikTok analytics shows you what to do next. Here is how to use your data to create stronger content, connect with the right audience, and grow your POD business.
Before optimizing individual videos, map your full sales funnel using TikTok data. Every sale on TikTok Shop moves through three stages:
Views → Clicks → Conversions
Each stage reveals a different problem if the numbers drop off:
| Funnel drop-off point | What it signals |
|---|---|
| High views + low clicks | Weak hook, unclear product relevance, or missing CTA |
| High clicks + low conversions | Pricing issue, weak listing, or trust gap |
| High engagement + no sales | Impulse triggers missing – urgency, scarcity, or social proof |
Track all three stages together. A video with 50,000 views but zero product clicks delivers no real business impact, regardless of how high the engagement rate looks.
Start in the Content tab and sort by engagement rate, average watch time, and video views. Look for patterns across your top-performing posts:
Identifying content winners and product winners separately matters. One video might drive high engagement without sales. Another might convert at 4% with modest reach. The goal is to find videos that do both and replicate their structure.
Most sellers track content performance. Fewer track product performance.
Use your analytics to identify:
One winning product can generate dozens of videos and thousands in revenue. When you spot a product that converts consistently, even at modest view counts, scale it. Create more content variations, recruit affiliates to promote it, and run GMV Max Ads to amplify what already works.
Check the Followers tab to see when your audience stays most active. Posting during those peak windows increases video views without requiring paid reach.
If your content performs inconsistently, timing may be the variable, instead of the content itself. TikTok’s algorithm favors accounts that post consistently during high-engagement windows. Use a custom date range to compare how performance shifts across different posting times, and adjust your content calendar accordingly.
Use TikTok analytics to test formats systematically. Run two or three variations of the same product and compare average watch time, video completion rate, follower growth per post, and click-through rate.
If tutorials outperform trend-based content for your audience, double down on how-tos and explainers. If on-body product reveals outperform flat-lay shots, shift your production setup. Let the data guide the format.
Instead of guessing which tags to use, check which hashtags contributed to your top-performing posts in the Content tab. Then use TikTok Creative Center to validate trending product categories in your niche, identify high-performing keywords gaining search volume, and spot rising content formats before they saturate.
Test hashtags and audio across multiple posts and track their impact on reach and watch time. If specific hashtags consistently drive more profile visits or longer average watch time, build them into your standard posting process.
TikTok counts a view after just three seconds, and the algorithm uses that early engagement to decide how widely to show your video. Use analytics to measure how many viewers make it past that threshold, especially by checking average watch time and video completion rate.
Videos with high drop-off in the first three seconds may need stronger hooks or quicker intros. Content that keeps users watching past the halfway mark usually performs better across the board.
Open with a surprising visual, a bold statement, or an emotional pull that connects directly to the product. Then use your analytics to validate which approaches keep people watching.
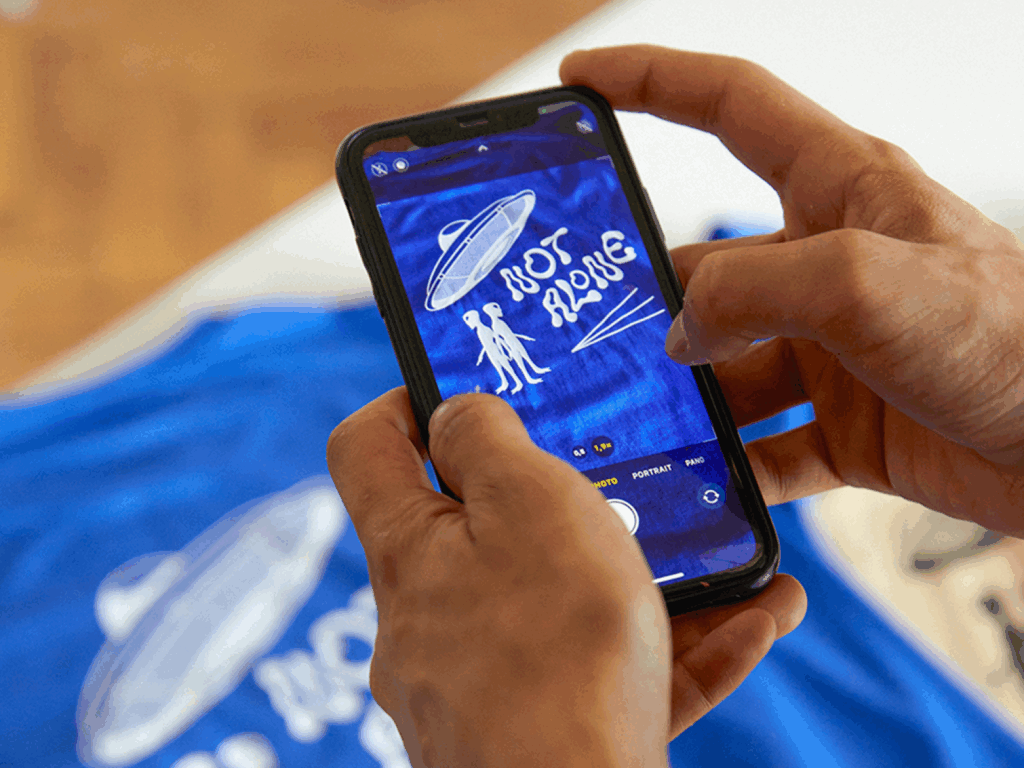
Print on Demand (POD) is the best way to sell on TikTok. You don’t need to hold inventory, and there are no upfront production costs. You create designs while Printify’s network handles printing, packing, and shipping. Connect Printify and add products to your TikTok Shop, and every video becomes a potential storefront.
Printify connects sellers to 350+best-selling merch items with fast fulfillment, competitive pricing, and global shipping. The direct TikTok Shop integration syncs products automatically and sends orders straight to fulfillment, so your TikTok efforts go toward content and growth, not logistics.
Launch your TikTok POD business in four steps:
To access TikTok analytics, go to your TikTok profile, tap the Menu icon (☰), and select Creator tools > Analytics. This opens your dashboard with native TikTok metrics, including video views, audience activity, and traffic sources. Switching to a business account unlocks additional engagement data and more detailed content metrics.
TrendTok offers both free and paid versions. The free plan includes basic trend discovery and audience targeting tools. For more advanced features, such as competitor tracking, performance metrics, and automated reporting processes, users must upgrade to a paid plan. It’s one of several third-party tools that offer deeper insights beyond native TikTok analytics.
No. TikTok analytics is only available on Creator and Business accounts. Personal account users need to switch in their settings. After publishing at least one video, you can access analytics including engagement rate, follower growth, and video views.
If analytics remain unavailable, the most common causes are using a personal account, no recent posting activity, or a short data delay after switching account types. Switch to a business account or Creator profile, publish content, and your TikTok metrics will show up within 24–48 hours.
You don’t need a minimum follower count to access TikTok analytics, but you must switch to a Creator or Business profile and publish at least one video. After that, you’ll see data like follower count, audience activity, and TikTok followers analytics in your dashboard.
TikTok analytics lets you track TikTok performance using metrics like watch time, top viewer count, engagement rate, and audience demographics. These insights help you understand your audience, identify top-performing posts, and refine your social strategy based on actual data.
Combine native TikTok insights with third-party analytics platforms to have a fuller picture of what drives real business impact and what to cut.
TikTok analytics gives POD sellers a direct line into what their audience responds to. Tracking the right TikTok metrics, such as average watch time, engagement rate, conversion data, and follower growth, allows you to move from merely guessing to knowing.
Access analytics through your business account, use the data to sharpen your content calendar, and identify which individual posts drive real TikTok Shop orders. Combine TikTok insights with Printify’s POD tools, and your content does more than build an audience – it generates revenue.
The post TikTok analytics for POD sellers: A complete guide appeared first on Printify.