More Reviews and Stronger Average Ratings Increase Product Page Visits
Key Findings:
- Basic review information – typically review count and average rating – is usually displayed at earlier discovery-focused stages of the digital shopping journey to create interest and ultimately drive traffic to specific product pages.
- This article explores the relationship between review information and resulting page views by examining shopper activity across a representative sample of 8.8 million product pages.
- A higher volume of reviews and favorable average product ratings clearly drive more traffic to product pages.
When it comes to conversions on product pages and reviews, the evidence is very clear: a strong reviews footprint (i.e. average ratings of more than 4 stars and high review volumes) leads to more conversions.
But how much of an
Understanding the Digital Shopper Journey
Average rating and review volume are displayed prominently throughout most digital shopping journeys, being prioritized by most sites at the early stages of the funnel.
Typically, this information is published alongside a product image, price (including any discount) and shipping specifics on Product Listing Pages (PLPs), search result pages and even – in some cases – home pages.
Review Volume Impact on Traffic – All Ecommerce Sites
The below two charts are an analysis of all time site behavior across an illustrative sample of more than 8.8 million Product Display Pages (PDPs) from brand and retailer sites – which accounts for more than 27.7 billion page visits in total.
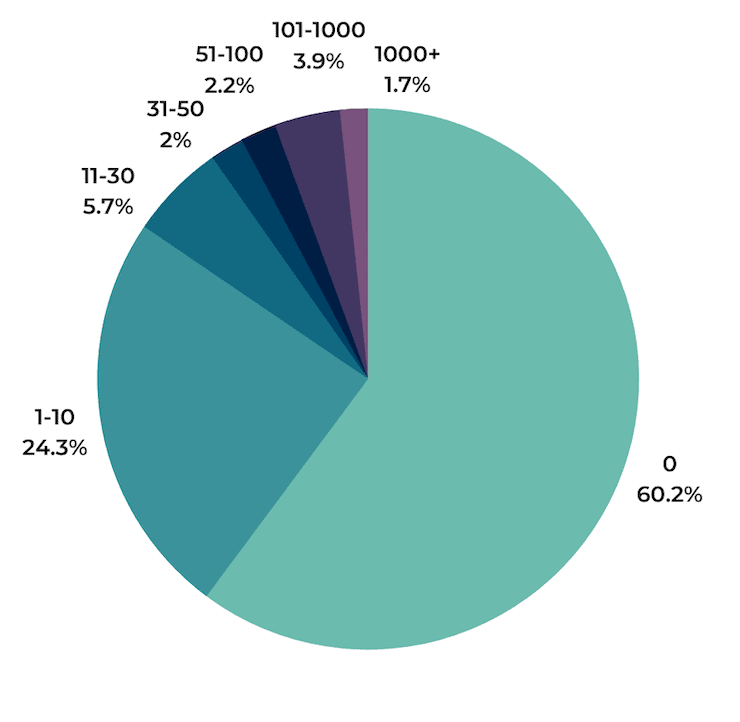
The first chart highlights the percentage of total PDPs that exist of those we analyzed with the corresponding review volumes at the time the data was pulled.
Once a page has reviews displayed, it outperforms in terms of % of visitors going to that page relative to the % of total product pages it represents.
PDP Count Per Number of Displayed Reviews
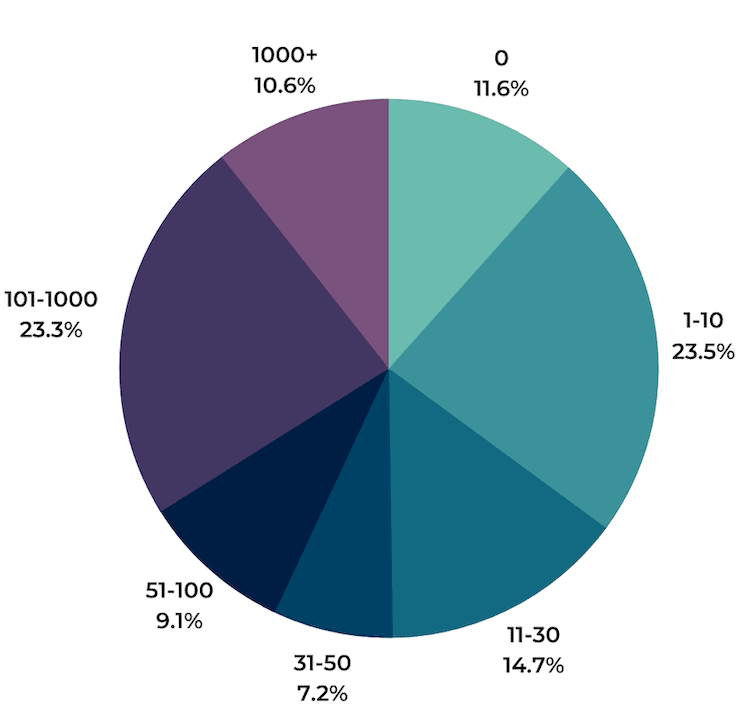
Page Views Per Number of Displayed Reviews
Analysis based on an illustrative sample of 8,841,414 Product Display Pages (PDPs) – which accounts for 27,702,856,033 page visits in total. Review volume data correct as at August 11, 2022.
Bottom line: having any reviews on your product pages drives more traffic to those pages.
Across all the product pages we analyzed, the overwhelming majority (60.2%) don’t have any reviews. However, these PDPs only accounted for 11.6% of all page visits. This firstly demonstrates the huge opportunity for brands and retailers with review-less product pages.
Beyond that, this analysis clearly illustrates how the presence of reviews leads to significantly higher volumes of traffic to product pages.
The obvious next question to ask is how many reviews do I need to experience the benefits? This is never an easy question to answer as there is so much nuance and individual circumstance involved.
In the above, for example, around a quarter of all page visits occur on pages with between one and ten reviews. But this also accounts for a similar proportion of pages analyzed.
There are simply fewer pages with higher review volumes, and that’s because collecting reviews is hard. This means that that dataset is smaller.
However, we start to see the biggest increments in traffic for products with 11 reviews or more. And the numbers for pages with more than 100 reviews clearly standout.
Overall, these account for 2% of pages but 31% of traffic (both totals are rounded to the nearest whole number). So we can say with confidence that this should be the aspiration for all brands and retailers looking to get more eyeballs on their product pages and their products.
Review Volume Impact on Traffic – Retailer Sites
Brands selling their products on retail sites are of course preoccupied with standing out on and maximizing returns from those channels. So, drivers of traffic to PDPs is something they should be thinking about – assuming they are not already.
In this section, we therefore restrict the analysis to the retailer websites included in the above sample – examining the relationship between product page visits and review volumes on those product pages.
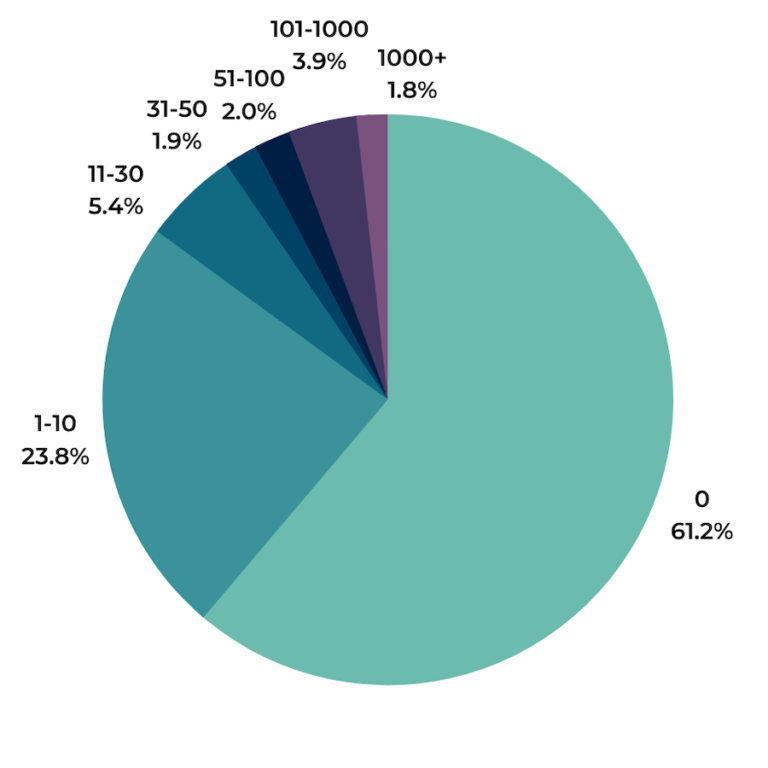
PDP Count Per Number of Displayed Reviews
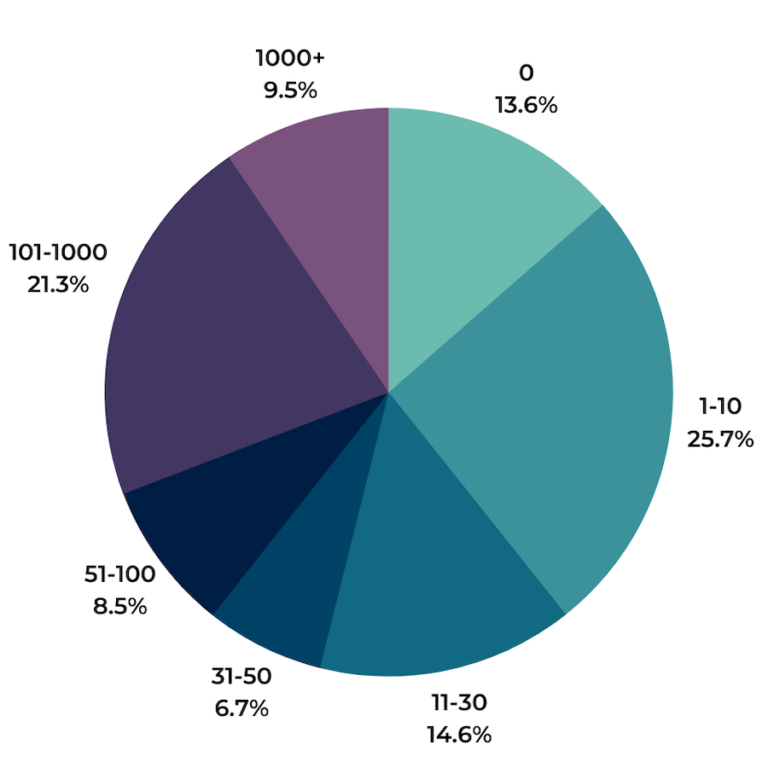
Page Views Per Number of Displayed Reviews
Analysis based on an illustrative sample of more than 8,105,477 Product Display Pages (PDPs) – which accounts for 19,838,070,215 page visits in total. Review volume data correct as at August 11, 2022.
While the numbers deviate a little, the main trends are similar to the combined brand and retailer analysis.
For brands looking to stand out on retail channel websites, there are three key takeaways: while the majority of product pages (61%) do not have reviews, those that do attract significantly more traffic and – for the most part – the more reviews, the bigger the page view gains.
In other words: ensuring that you have the maximum volume of reviews on your product pages on retailer sites is a critical retail channel marketing strategy.
Average Rating Impact on Traffic – All Ecommerce Sites
Typically, an average rating is displayed alongside a review count at any time it is highlighted in the buyer journey. The chart directly below – a different methodology from the above analysis – highlights the lift in traffic volumes over the average rating band with the lowest review volume (1.0 – 1.9 average rating).
For full transparency, we also wanted to highlight the average review volumes of products in each of the average rating bands. This is the total volume of reviews for products in that average rating band divided by the total volume of products in that average rating band.
As identified in the above section, review volume clearly has a factor on traffic and – as indicated here – is correlated to the average rating of the product.
Impact of Average Star Rating on Page Traffic
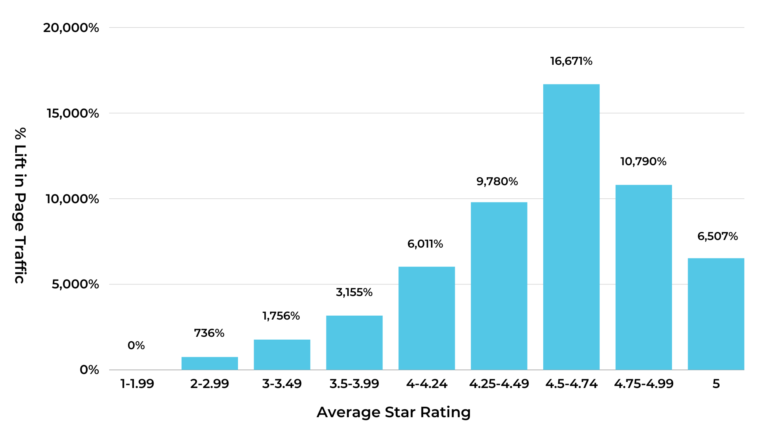
Analysis based on an illustrative sample of 8,841,414 Product Display Pages (PDPs) – which accounts for 27,702,856,033 page visits in total. Review volume data correct as at August 11, 2022.
In line with our conversion-based analysis on the
Products in the 4.5 – 4.99 average rating range attract the most traffic and highest review volumes, making this the absolute sweet spot.
Consumers are skeptical of 5.0 average star ratings. They typically follow the mantra: if something looks to be good to be true, it invariably is.
Average Rating Impact on Traffic – Retailer Sites Only
But what
In this section, we again restrict our analysis to the retailer websites included in our sample – examining the relationship between product page visits and average rating on those product pages.
Impact of Average Star Rating on Page Traffic for Retailer Sites
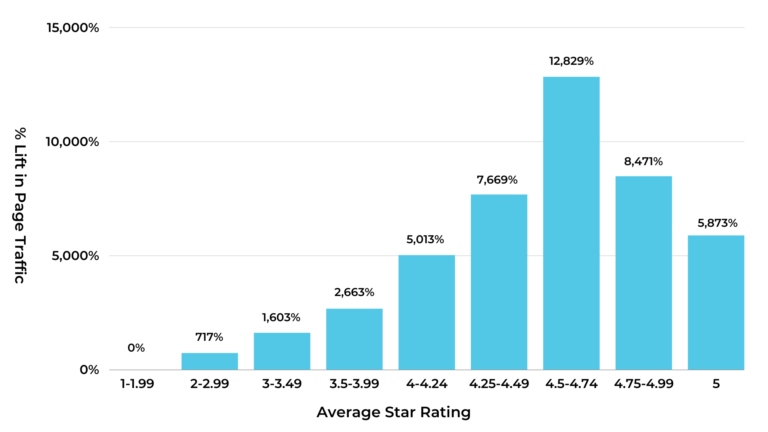
Analysis based on an illustrative sample of more than 8,105,477 Product Display Pages (PDPs) – which accounts for 19,838,070,215 page visits in total. Review volume data correct as at August 11, 2022.
As with the brand and retailer analysis, the retailer only segmentation demonstrates the same themes: that more than four stars should be the goal and that 4.5 – 4.99 average rating range is the absolute sweet spot for traffic (and review volume).
However, the specific numbers do differ slightly. For example, 4.5 – 4.74 average rating products experience lower traffic lifts in the retailer only analysis (12,829% vs 16,671% for brands AND retailers).
But – really – this is splitting hairs. The overall
Key Takeaways
- Your ratings and reviews footprint and presence has a significant
impact on your ability to capture interest earlier in the customer journey and pull shoppers into your funnel. - You should aim for a minimum average rating of 4.0 stars across a minimum of 11 reviews for each product in order to drive traffic to your product pages.
- However, any improvement on either of these baselines will create meaningful performance improvements.
Note: We use the terms Product Display Page (PDP) and Product Page interchangeably above. They have the same meaning in the context of this article.
The Complete Guide to Ratings & Reviews