
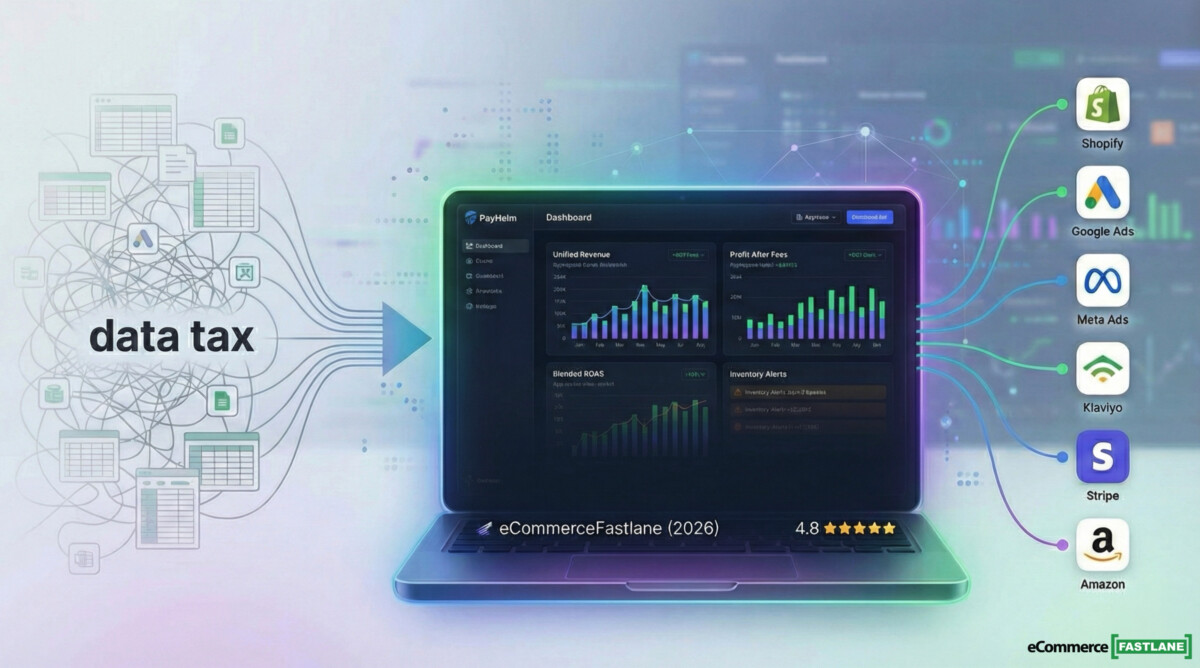
Every morning, there’s a hidden cost most Shopify founders don’t track. I call it the data tax.
That’s the 30 to 90 minutes you burn bouncing between your Shopify admin, Google Ads, Meta Ads, Klaviyo, Stripe, and a spreadsheet that somehow became “the source of truth” by accident. Brands don’t usually fail because they lack data. They fail because they can’t agree on the number that matters today, so decisions stall or worse, they happen on gut feel.
This PayHelm review is written for the real world. If you’re doing $5K/month, you need confidence your numbers are right. If you’re doing $500K/month, you need ROAS and profit clarity across channels, fast. Here’s what PayHelm actually delivers, where it falls short, and who should pick something else.
The core promise is simple: unified analytics (300+ metrics), scheduled reports, and AI-assisted insights, all in one place. PayHelm is trusted by 10,000+ ecommerce businesses, and the platform is built to replace the tab-switching ritual most operators run every morning.
If you want a single dashboard that pulls Shopify plus ads, email, payments, and shipping into a single reporting rhythm, PayHelm is a good fit. I’d recommend it most for growth brands and multi-platform sellers who are tired of weekly CSV exports.
If you only need Shopify’s built-in reports, or you’re buying an attribution tool first (not a reporting hub), you’ll probably skip it.
PayHelm is built for operators who want fewer tabs, fewer arguments, and more confident calls 😉
Early stage pain is simple: “Do I trust today’s revenue, orders, and top products?” You don’t want another tool that needs setup days, and you don’t want to pay for features you won’t use.
Growth stage pain changes: now you need profit visibility (fees, COGS, shipping), plus ROAS across channels, without stitching exports together every week.
Larger teams and agencies need a consistent reporting engine: role-based access, automation, and fewer spreadsheet handoffs. PayHelm positions itself for that with SOC 2 Secure claims, encryption, role permissions, and an advertised 99.9% uptime posture.
PayHelm slashes reporting time with automation, letting your team focus on decisions—not spreadsheets. Customers who use scheduled dashboards typically cut reporting work by about 60% by eliminating manual rebuilds.
One pattern I see across brands: as revenue grows, reporting doesn’t scale linearly, it balloons. A founder can “wing it” at $5K/month. At $150K/month, winging it turns into bad inventory calls and noisy ROAS debates that waste hours every week.

Most founders don’t wake up wanting “300+ metrics.” They wake up wanting answers.
PayHelm’s feature set makes the most sense when you group it into three outcomes:
PayHelm groups its analytics into ecommerce, inventory, product, marketing, and customer analytics, plus an AI layer (including a ChatGPT-style interface) so you can ask questions in plain language instead of building every report from scratch.
If your current workflow is, “Export Shopify, paste into Sheets, match ad spend by hand,” this is the type of platform meant to replace that routine.
PayHelm’s big promise is focus: one place to check the business every day, with automation doing the boring parts in the background.
The daily workflow is straightforward: revenue trends, net sales, total orders, profit after fees (when connected to payments), and channel performance once ads are connected. PayHelm also supports scheduled reports and a “daily snapshot” style email, which matters more than people admit. If the report shows up every morning, you actually read it.
For teams still living in spreadsheets, PayHelm supports exports to Google Sheets. That’s not glamorous, but it’s practical. Many brands use a dashboard for decisions, then Sheets for finance tie-outs.
PayHelm reports that its dashboards cover 300+ metrics across sales, customers, products, and marketing. In practice, the win is not the count, it’s that you stop rebuilding the same weekly report.
Here’s the best operational test: if you can answer “What changed since yesterday, and why?” in under five minutes, the dashboard is doing its job.
Product analytics is where brands often get surprised. The best seller isn’t always the best product. A SKU can lead revenue while quietly dragging margin down.
PayHelm includes SKU-level performance views and profitability-style reporting. It also offers inventory analytics that can highlight depletion trends, so you spot a reorder signal before a stockout ruins a weekend.
Concrete examples that matter:
One catch: PayHelm notes that inventory analytics may be an add-on at certain tiers. Confirm what your plan includes before you build planning workflows around it.
Profit reporting is only as clean as your inputs. If COGS is wrong, the dashboard will confidently show you the wrong truth.
PayHelm connects to ad platforms like Google Ads and Meta Ads, then rolls performance into a unified view. That matters because each ad platform grades itself generously. A blended view helps you see where orders actually land.
PayHelm also positions its attribution features as “AI-powered,” with multi-touch-style modeling support. That’s directionally useful, but attribution still has hard limits. Tracking setups vary, privacy rules reduce visibility, and cross-device behavior breaks neat stories.
So here’s the right expectation: no tool makes attribution perfect, but some tools make it less wrong than staring at separate platform dashboards.
PayHelm also claims average ROAS improvement figures at the platform level (it references around 35% average ROAS improvement). Treat that as a signal of what’s possible when teams act on insights, not a promise.
A good analytics tool doesn’t just tell you “ROAS is 3.1x.” It helps you answer, “Which channel got worse this week, and what do we change on Monday?”
PayHelm is more than a Shopify reporting add-on because it connects beyond Shopify. That’s a big deal once you sell on multiple platforms, or you run multiple stores.
PayHelm lists ecommerce connections such as Shopify, BigCommerce, WooCommerce, Wix, and marketplaces like Amazon, eBay, Etsy, and Walmart. For a brand doing $100K on Shopify and $40K on Amazon, two dashboards quickly become a spreadsheet project.
PayHelm markets 50+ integrations, and it also references 180+ total available connections across categories (ecommerce, marketing, payments, shipping, support, analytics, and automation). It also says new integrations get added based on customer requests.
The practical value is simple: one place to answer, “How is the business doing across all channels?” without a manual merge every week.
Multi-platform breadth is also a trade-off. You may not get every Shopify-only reporting nuance that a Shopify-first specialist builds.
Most Shopify brands start with the same core stack, and PayHelm supports many of them: Google Ads, Meta Ads, Klaviyo, Stripe, PayPal, ShipStation, and Google Sheets. It also lists Slack and OpenAI connections, including a ChatGPT-style interface for querying analytics.
Two cautions before you commit:
Treat integrations like load-bearing beams. Confirm limits first, then build process.
Setup is usually a two-step reality. First, connect Shopify. Then connect the sources that create most of your confusion, usually ads and email.
PayHelm describes its pipeline as an automated ELT-style system with real-time syncing. In plain English, it’s meant to pull data in automatically and keep it current.
In week one, don’t just stare at dashboards. Verify the basics:
Most “analytics problems” are setup problems that got ignored for 30 days. Fix them early and everything downstream improves.
When teams onboard a reporting tool, the fastest win is alignment. If finance and marketing agree on net sales and ad spend in one place, meetings get shorter, and decisions happen faster.
Set these up early and you’ll feel the impact quickly:
Some of these depend on plan level. PayHelm notes custom reports and formula-based metrics are tied to paid tiers, so confirm before you promise your team a fully custom setup.
Automation is only valuable if it’s consistent. Pick five reports, schedule them, and stop rebuilding them by hand.
PayHelm uses a sales-capped pricing structure. As your monthly sales grow, you move tiers. Based on public pricing references in early 2026, the structure looks like this (always confirm on PayHelm’s pricing page and the Shopify App Store listing, because details can vary).
PayHelm also advertises a 14-day trial and a 20% discount on annual billing. It also notes that inventory analytics and traffic analytics can be add-ons.
Pricing only matters relative to what you replace, and how many hours you get back.
If PayHelm helps you stop making one bad inventory decision per quarter, it pays for itself fast.
The sales cap is the obvious trigger, but it’s not the only one. For many teams, the real upgrade triggers are:
PayHelm notes that accounts can auto-upgrade when sales cross a tier threshold. It also states you can upgrade, downgrade, or cancel.
This model is fair if the value grows with your complexity. It’s annoying if you only want one feature.
For stores under $10K/month, the Free plan is the move. You get structured analytics and reporting without another fixed cost, and you can learn what KPIs you actually care about.
For $10K to $100K/month, use a simple test: if PayHelm saves you even 2 hours a week of reporting and helps you catch one weak campaign a month, the math works. Time is expensive, and bad ad spend is more expensive.
For $100K+/month, cost isn’t the question. Coverage is. Decide if PayHelm becomes your main reporting hub, or if it supplements a deeper attribution tool.
PayHelm references platform-level improvements like 35% average ROAS improvement. Your result depends on tracking quality and how often you act on insights.
If you don’t change decisions, no dashboard will save you.
PayHelm is strongest when you treat it as your reporting backbone. It’s less compelling if your only goal is attribution science.
This is the trade: breadth and workflow automation versus specialist depth in one narrow area.
Choose based on the problem you’re solving. Are you trying to stop reporting chaos, or are you trying to squeeze the last 10% of measurement accuracy out of paid media?
Clarity on that question will save you months.
Pros
Cons
The cleanest way to evaluate PayHelm is to run it against your current weekly reporting routine. If it replaces that routine, it’s a win.
Think of these as different hires:
Here’s the deciding question: are you solving a reporting and visibility problem, or an attribution depth problem?
PayHelm sits in a practical lane: fewer tabs, fewer spreadsheets, more repeatable reporting. If attribution science is your main goal, start with Northbeam or Triple Whale.
Yes – PayHelm connects to Shopify, BigCommerce, WooCommerce, Wix, plus marketplaces like Amazon, eBay, Etsy, and Walmart. This makes it stronger than Shopify-only tools if you sell across multiple channels.
Typically $50-$100/month at that revenue level. Pricing scales with monthly sales, and you get 20% off with annual billing.
A: Different strengths. PayHelm excels at cross-platform reporting and automation. Triple Whale is stronger for Shopify-native attribution and creative insights. Choose based on whether you prioritize breadth (PayHelm) or Shopify depth (Triple Whale).
Not verifying COGS data in week one. Profit reports are only accurate if your cost inputs are correct.
Yes – PayHelm supports scheduled exports to Google Sheets, which is critical for finance tie-outs.
PayHelm fills a real gap for Shopify operators drowning in tab-switching and manual reporting, especially if you sell across platforms. The Free tier makes it a low-risk starting point, and the paid tiers make sense once ROAS visibility and scheduled reporting save real hours.
Stage-specific guidance:
First 30 Minutes Action Plan
If you want to try it, use this link: Try PayHelm

