Singapore SMEs should treat SEO as a long-term demand-generation asset, not a substitute for every paid campaign. The right strategy aligns local or international search scope with actual revenue markets, fixes technical barriers first, measures qualified leads and revenue, and verifies whether eligible pre-approved digital solutions can receive PSG support.
Paid search buys the right to appear today. SEO builds the evidence, relevance, and technical foundation that can keep bringing qualified buyers after today’s media budget is spent.
Shelf space is a finite and expensive resource. Every square metre in a retail store carries a cost — rent, staffing, energy, and the opportunity cost of what that space could be generating if it were allocated differently. Yet in most retail businesses, the decisions that govern how that space is used are still made inconsistently, updated infrequently, and rarely tied directly to sales performance data.
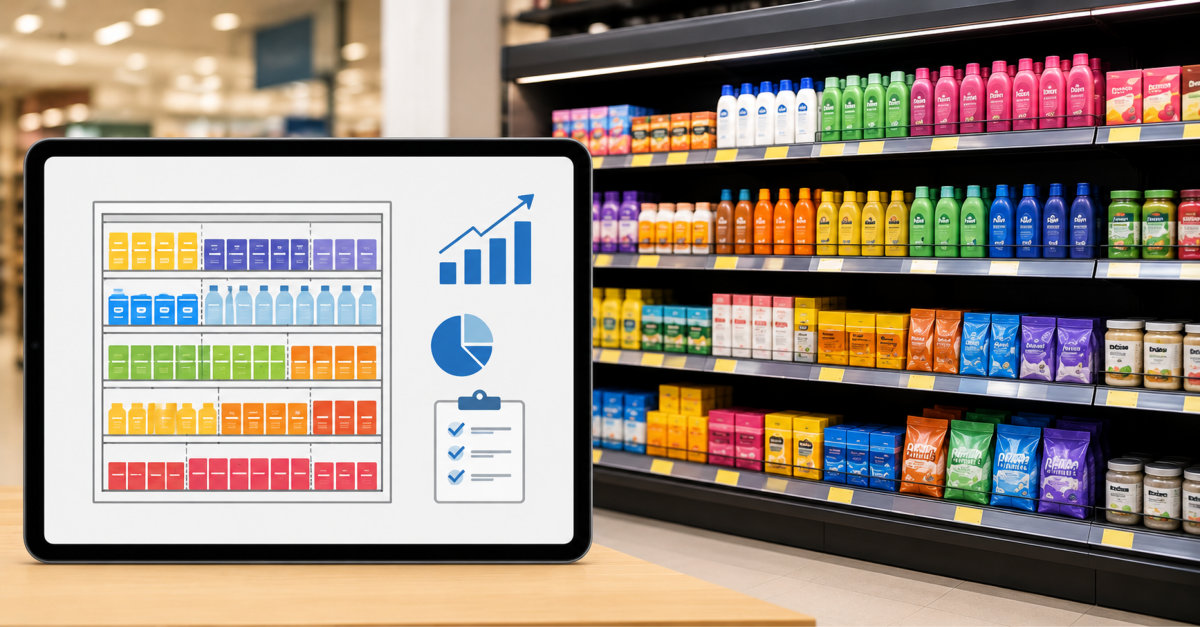
Planograms change the basis on which those decisions are made. At their core, a planogram is a visual map of how products should be arranged on a shelf or fixture — which items go where, how many facings each receives, what the adjacencies are, and how the display should look from the customer’s perspective. That description understates what a well-executed planogram process actually delivers. The benefits of planograms extend well beyond shelf organisation into store economics, supply chain efficiency, customer experience, and supplier relationships.
This article covers why use planograms in retail, what the measurable advantages look like in practice, and where the limitations of manual planogram processes tend to appear as businesses scale.
Before examining planogram benefits, it helps to be clear on what the alternative looks like. In stores without planograms — or with planograms that are outdated, inconsistently applied, or ignored — several predictable problems emerge.
Products are placed by habit or by whoever stocked the shelf most recently. High-margin items end up at floor level because that is where the space was available. Slow movers occupy prime eye-level real estate while fast-sellers run out of facing and face inconsistent availability. New range launches land in arbitrary positions because no one has explicitly planned the space. Promotions disrupt the shelf and nothing returns to its original position correctly afterward.
The result is a store that performs below its potential not because of footfall, pricing, or product quality problems, but because the physical environment is not doing its job. Planograms are the mechanism that fixes this — and the advantages of planograms in well-run retail operations are both broad and measurable.
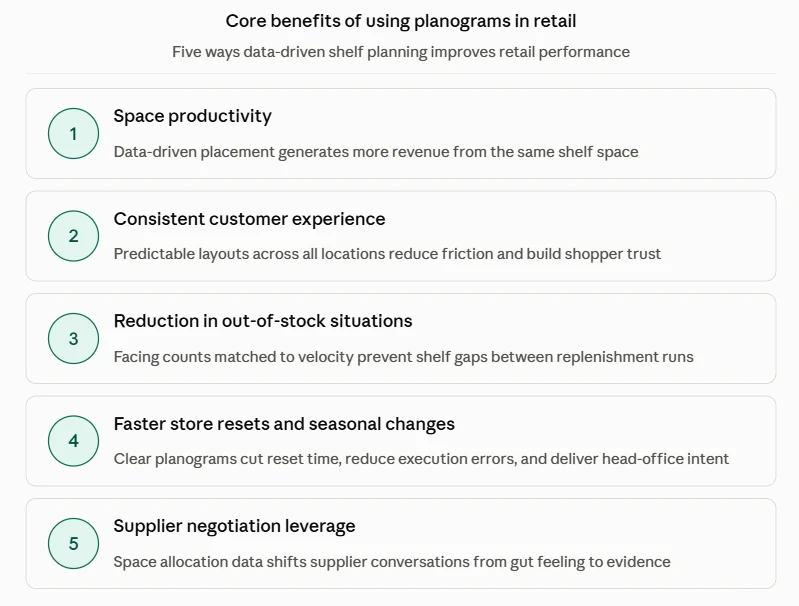
The most direct of the benefits of planograms is the improvement in sales generated per square metre or square foot of selling space. When product placement is determined by sales data — velocity, margin contribution, turnover rate, and category role — rather than by convention or convenience, the same physical space produces more revenue.
Retailers using data-driven planogram processes consistently report improvements in space productivity metrics after implementation. The mechanism is straightforward: high-velocity products receive more facings, reducing the frequency of out-of-stocks on the lines that matter most. High-margin products receive better positions. Slow movers are rationalised or relocated to less premium positions, freeing space for items that earn it.
For any retailer operating more than one store, planogram benefits include the ability to deliver a consistent shopping experience regardless of location. When customers know that the dairy aisle, the wine section, or the household cleaning category is arranged in a predictable way, navigation becomes effortless. Familiarity builds trust and reduces the friction that causes shoppers to leave without finding what they came for.
Without planograms, consistency across a chain depends on individual store managers making similar decisions independently. In practice, this produces significant variation — stores that look and feel different from each other in ways that undermine the brand and create an uneven customer experience.
One of the clearest advantages of planograms is their direct connection to availability. A planogram that correctly determines the number of facings a product requires — based on its sales velocity, delivery frequency, and shelf capacity — reduces the frequency of out-of-stock situations at the shelf level, even when the backroom holds sufficient stock.
Insufficient facings cause shelf gaps to appear faster than replenishment cycles can address. Planograms that are calibrated to demand patterns prevent this by ensuring that each product has space proportional to how quickly it sells.
Range changes, seasonal resets, and promotional setups all require stores to reorganise significant sections of the shop floor under time pressure. Without a planogram, this process relies on verbal briefings, printed guides of questionable clarity, and individual store teams interpreting instructions differently.
The benefits of using planograms in retail are particularly pronounced at these moments. A clear, product-specific planogram reduces the time a store reset takes, reduces the errors that occur during execution, and ensures that the result matches what head office intended rather than what each store team approximated.
Planograms create documented, defensible data on how shelf space is allocated across categories and between brands. This data is directly relevant to supplier negotiations. When a retailer can demonstrate that a brand currently occupies a specific facing count and position, and can show the sales productivity of that space, the conversation about promotional investment, listing fees, and ranging decisions shifts from subjective to evidence-based.
The advantages of planograms in supplier relationships are often underestimated — particularly for retailers that have historically made ranging and positioning decisions informally.
The financial case for why use planograms in retail becomes clearer when the outcomes are expressed in operational terms rather than abstract improvement percentages. The table below summarises the primary benefit areas and the mechanisms through which they affect business performance:
|
Benefit Area |
Mechanism |
Business Impact |
| Space productivity | Data-driven facing allocation | Higher sales per metre/foot |
| Stock availability | Facing counts matched to velocity | Fewer shelf gaps and lost sales |
| Customer experience | Consistent layouts across locations | Stronger navigation and conversion |
| Execution efficiency | Clear store-level instructions | Faster resets, fewer errors |
| Supplier leverage | Documented space allocation data | Stronger commercial negotiations |
| Range rationalisation | Performance-based space decisions | Reduced slow-mover carrying cost |
| Promotional execution | Pre-planned display positioning | Faster campaign activation |
The common thread across all of these is that planogram benefits are realised through process discipline rather than any single technology decision. The planogram is only as effective as the process that creates it, distributes it, and verifies that it has been executed correctly.
Understanding the benefits of using planograms in retail also requires understanding where the conventional approach to managing them limits those benefits in practice.
The most common limitations of manual planogram processes include:
These limitations do not reduce the value of planograms as a practice — they reduce the value of the planogram process as it is currently implemented. Closing the gap between what a planogram could deliver and what it actually delivers in practice is largely a question of how the process is supported.
For retailers evaluating how to modernise their approach, reviewing available planogram software options is a practical starting point — there are meaningful differences in how platforms handle automation, data integration, and compliance verification that are worth understanding before making a decision.
One aspect of planogram benefits that receives less attention than it deserves is the upstream effect on supply chain planning. A planogram is not just a store execution document — it is a statement about how much space a product occupies and therefore how quickly that space will empty under different demand conditions.
When planogram data is connected to replenishment systems, the facing counts and product dimensions in the planogram can directly inform safety stock calculations and replenishment frequency. A product with two facings in a high-traffic store needs to be replenished more frequently than the same product with four facings in a quieter location. Without that connection, replenishment operates on averages that do not reflect the physical reality of the shelf.
This integration represents one of the less visible advantages of planograms — their ability to serve as the bridge between merchandising strategy and supply chain execution when the data flows in both directions.
The benefits of using planograms in retail are not static. A planogram process that is well implemented and consistently updated becomes more valuable as the data it generates accumulates. Historical planogram performance data — which adjacencies drove cross-sell, which facing counts minimised out-of-stocks, which positions drove the strongest conversion for promotional items — creates a knowledge base that informs better decisions in future planning cycles.
This compounding effect is one of the reasons that retailers who invest in planogram discipline early tend to pull ahead of competitors who treat it as an administrative task rather than a strategic one. The gap in space productivity, supplier leverage, and execution quality widens over time as the knowledge embedded in the planogram process deepens.
The full range of advantages of planograms is only available to retailers that meet certain operational conditions. Partial implementation — creating planograms but not verifying execution, or distributing planograms but not updating them — produces partial results and can create a false impression that planograms have limited value when the reality is that the process has limited rigour.
The conditions under which planogram benefits are most fully realised are consistent: planograms are built from SKU-level sales and margin data rather than supplier recommendations or convention; they are updated at a frequency that reflects how quickly the assortment and demand patterns change; store teams receive clear, accessible execution instructions; compliance is verified and exceptions are followed up; and planogram performance is measured in terms of sales per metre and availability rather than simply whether a planogram exists.
For most retail businesses, the question is not whether planograms are worth using. The evidence on why use planograms in retail is clear. The more productive question is whether the current planogram process is capturing the benefits it should — and where the gaps between what is possible and what is being delivered are largest.