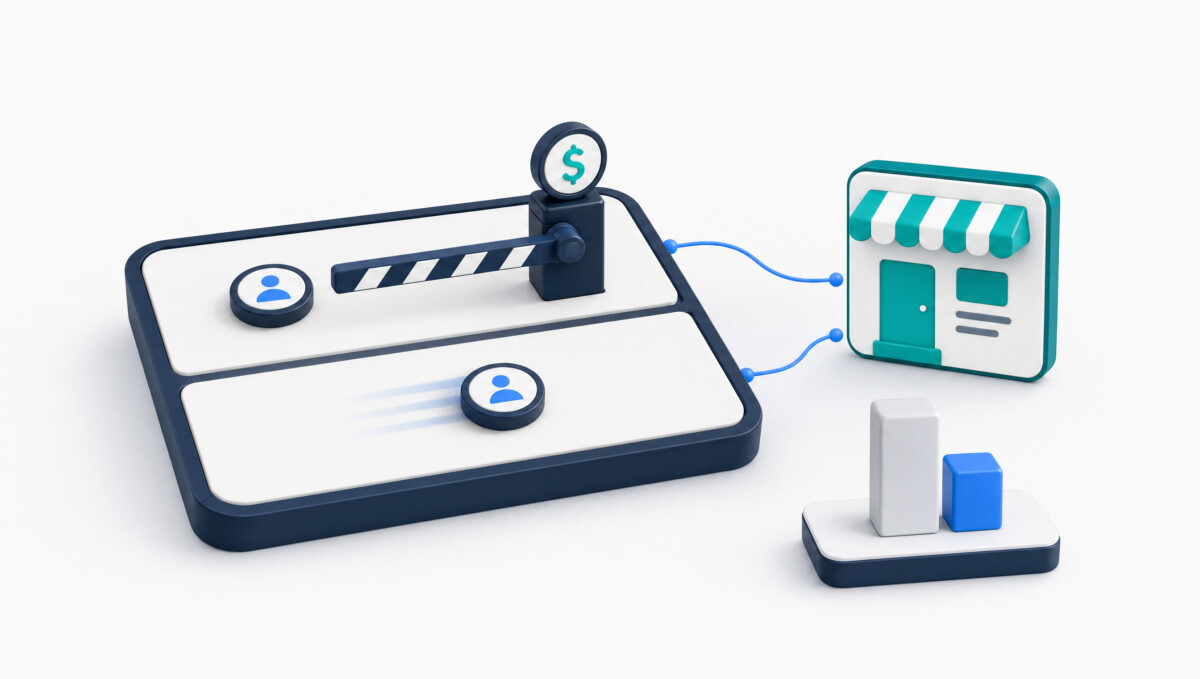
Branded search usually returns far less than your Google Ads dashboard claims. Across 225 geo tests of DTC brands, Google Search Branded posted a median incremental ROAS of 0.70x. Treat it as a defensive floor you size by test, not as a growth channel.
A 24.7x return on the dashboard and an 8.5x return in the model are the same spend measured two ways. Only one of them pays the bills.
You are scaling a DTC brand on Meta. Things are working. So you turn on Google Ads to capture the demand you are creating, and the platform numbers look extraordinary. ROAS is strong, conversions are flowing, and it feels like fresh revenue stacked on top of what social already delivers.
That feeling is the expensive part. The pattern underneath is specific and measurable: branded search and high-intent paid keywords often capture clicks your organic listing already won for free, and the platform reports the recapture as growth. Measured, which runs incrementality testing for brands, puts it plainly in its guidance on how accurate marketing budget decisions get made: “A channel can have excellent attributed metrics and be generating almost no incremental return.”
This is a cross-channel reality check, not an argument for turning Google Ads off. What follows is how to find the waste, how much to cut, how long to watch before you believe the result, and where the money goes instead. Below about $500K a year, the diagnosis still applies, but the dollars rarely justify the test.
Branded search ROAS reads high because paid ads collect demand your organic listing had already earned, and the measured gap between reported and incremental return commonly runs 2 to 3 times. The mechanism is not new, and it is not a platform conspiracy. It is what happens when you buy an ad slot above a result you already own.
The foundational evidence is Google’s own. In 2012, David Chan, Deepak Kumar, Sheng Ma, and Jim Koehler published an analysis of 390 search ad pause studies covering advertisers who cut search ad spend by 95% or more. When a brand already held the number one organic ranking, only 50% of its paid ad clicks were incremental. At organic ranks two through four, 82% were. At rank five or lower, 96% were. The study is more than a decade old, which is exactly why it is useful: the structural relationship between organic position and paid incrementality hasn’t changed.
Current data says the same thing with fresher numbers. Stella’s 2025 DTC incrementality benchmarks, built from 225 geo-based tests run between August 2024 and December 2025 across brands that are roughly 90% Shopify, found Google Search Branded posted the lowest median incremental ROAS of any channel at 0.70x. Median incremental ROAS across all channels was 2.31x. Stella states that the gap between platform-reported ROAS and true incremental ROAS “often reaches 2 to 3x,” and adds a caveat worth carrying: its advertisers are self-selected and measurement-sophisticated, so Stella recommends discounting the benchmarks by 15 to 20% for planning. Measured reports the same shape from a different angle, finding that brands running rigorous tests frequently discover 30 to 50% of attributed revenue in channels like retargeting and brand search would have occurred without the advertising.
One brand’s numbers make the gap concrete. LuckyRev published a media mix modeling case study of an eight-figure DTC brand that had over 40% of its Google Ads budget on brand search. In-platform ROAS showed 24.7x. The media mix model put true incremental return at a median of 8.5 for the quarter. That is one brand, one media mix, one modeling approach, and not a benchmark. Read it as an illustration of the gap, not as the gap you will find.
The waste sits in two separate places: branded paid ads taking clicks your organic listing already earned, and your own campaign types competing against each other on the same terms. Most audits find both, and most brands only look for the first.
Start with the cross-channel version. On a webinar hosted by Northbeam, ecommerce marketing consultant and growth marketer Zack Miller described Google Ads for most DTC brands as inner-funnel traffic: it catches people who already know the brand from Meta. The typical seven-figure media mix he described was “mostly Facebook, a little bit of Google.” When that is the shape of your demand, overbidding on brand terms is both easy and invisible, because the people clicking were coming anyway.
The internal version is better documented. Optmyzr analyzed its managed accounts in February 2025 and found that 91.45% of 503 accounts had exact keyword overlap between Search and Performance Max campaigns, affecting 56.29% of 5,768 Search campaigns. Separately, Brad Geddes at Adalysis studied over 3,300 non-retail Performance Max campaigns and roughly 1.2 million search terms, finding that 45% of PMax search terms also triggered Search campaigns in the same account. Where overlap existed, PMax took more impressions 61% of the time, while Search held the higher conversion rate about 84% of the time. You are not only paying for organic clicks, but you are also routing them through the campaign type that converts them worse.
Miller also reported a Meta side reach problem that makes the Google overlap more costly: purchase optimized campaigns kept hitting the same users, with rolling reach flattening after an initial bump, and a separate incremental attribution campaign showed 32% reach overlap with the existing purchase campaign. Those are figures from his own account work rather than a published study, so treat them as one practitioner’s observation. If neither platform is reaching new people, every extra dollar buys the same audience twice.
Worth saying plainly, because we have published the other side of this: there is a legitimate defensive case for bidding on your own brand name, and we have covered how to protect your branded keywords on Google when competitors conquest them. Both are true. The defensive case justifies a floor. It does not justify 40% of a paid search budget, and the two get conflated because the dashboard never distinguishes them.
Run the audit by putting paid and organic metrics in one view over the same date range, then checking whether paid spend climbed while organic conversions stayed flat or fell. You cannot diagnose cannibalization while Google Ads and organic search live in separate reports, which is how most brands look at them.
Miller demonstrated the mechanic during the Northbeam webinar: in the campaign view, select Google Ads and Organic Search at the same time and watch whether additional ad spend produces additional revenue or buys traffic the brand was already capturing. It is a toggle, not a project. In that session, he reported cutting Google Ads budgets by as much as 50% with revenue staying flat, the cleanest signal cannibalization leaves behind.
On Shopify, the tooling is mature. Northbeam reconciles paid and organic in one place, and for brands already deep in the Shopify stack, Triple Whale’s cross-channel reporting covers the $50K to $500K monthly range, with incrementality testing in higher tiers. Any tool that stacks both data sets on one date range works. The constraint is almost never the software.
Clean campaign naming is what makes the view readable. Miller shared a tweet showing how a multi-SKU brand could see, only because of precise naming conventions, that one product category appeared as a top ad by daily spend while accounting for almost none of the total budget. Without that structure, the team would have pointed effort at the wrong category. Fix naming before you fix bids.
Escalate from audit to a formal incrementality test when five specific conditions hold, and skip the test when the one about competitive pressure does not. Seer Interactive named those conditions in June 2025 in its guidance on whether you are cannibalizing your own branded search: you rank number one organically for your branded queries, branded spend takes 20 to 30% or more of total paid search budget, Auction Insights shows little competitive pressure on those terms, leadership is prioritizing efficiency over volume, and you have CRM or lifetime value data for full funnel measurement. If that last condition is where you fall short, the fastest way to close it is asking buyers directly, which is the workflow in our piece on turning Shopify attribution insights into strategic action.
Seer’s read is that if most apply it, it’s time to test; if none apply, branded search may well be doing its job. In practice, the competitive pressure condition is the one that disqualifies brands most often. If three competitors are bidding on your name, the defensive value is real, and a reduction test will tell you less than you hoped because you will be measuring the cost of handing them the top slot rather than the incrementality of your own ad.
One upstream dependency sits underneath it all. If your attribution windows are wrong, the audit will mislead you, because upper-funnel campaigns look like failures inside a seven-day window. That’s what we covered with Scott Desgrosseilliers of Wicked Reports on 5-Forces attribution and scaling profitably, where the recommendation for top-funnel campaigns was 30 days or more. Get the window right first, then read the paid-versus-organic view.
Cut branded spend toward a calibrated floor rather than to zero, and read the result over six to twelve months instead of a single test window. The return lives in the reallocation, not the saving.
In the LuckyRev case, after the brand reduced brand search spend and moved budget into non-brand campaigns, modeled incremental return went from 8.5 to 14.7 in the following quarter, a 54% improvement, alongside 16% net sales growth. The case study is internally inconsistent on the size of the cut, stating a 75% quarter-over-quarter reduction in the body while its own summary says 40%, so use the direction and reallocation logic rather than the exact percentage.
Stella’s benchmark gives you a cleaner allocation rule than any single case can. At a median of 0.70x, branded search generates about $0.70 of truly incremental revenue per dollar spent, making it a defensive line item rather than a growth lever. The channel medians from those 225 tests, before Stella’s own recommended 15 to 20% planning discount:
Now the part most efficiency arguments leave out. Seer’s guidance warns that the damage of not owning your brand “doesn’t always happen overnight.” In year-long tests, the surprising finding is slow erosion: organic does not fully recover the lost paid volume. Over months, brands can see branded search volume decline as competitors reach users earlier, direct traffic and conversions soften as awareness weakens, and SERP control slips, leaving the brand with less say in the messaging a shopper sees first. Seer suggests six to twelve months of observation, and notes that a revenue dip appearing six months later may mean you underestimated what brand protection was doing.
That is the whole discipline in one sentence. The goal is not zero brand spend. It is a floor you test into gradually and monitor across quarters, because the cost of cutting too far doesn’t appear within the window where you declared victory.
Move the saved budget into prospecting and upper funnel channels that have shown verified incremental lift, and make incremental ROAS thresholds by channel your standing allocation rule. Without that rule, savings drift back into whatever the dashboard flatters this month.
Measured recommends a specific sequence, and it is the right order of operations: first set a floor on retargeting and brand search at the level that captures real lift, then move the freed budget into prospecting and upper funnel channels with demonstrated incremental lift. The thresholds, not the enthusiasm, decide what gets funded next quarter.
The Stella medians say where the headroom sits. Performance Max at 2.98x and Meta at 2.92x both clear the 2.31x all-channel median comfortably, while Google Search Non-Branded at 1.46x sits below it, meaning non-brand search earns funding by query intent rather than as a category. For brands at $500K to $2M a year, the practical move is usually narrower than a reallocation: trim branded to a floor, put the difference into one prospecting test with a stated threshold, and leave the rest of the account alone. Premature complexity is what kills brands at that stage, and a six-channel reallocation plan is premature complexity wearing a spreadsheet.
Owned channels deserve a look in the same pass, since the saved dollars do not have to stay inside paid. We have covered how DTC brands use SEO to offset rising paid social costs, with the honest caveat that organic takes six to twelve months to produce and is not a substitute for a working acquisition channel in the meantime. Treat it as a parallel investment, not a replacement.
Not every branded dollar is waste, and the strongest counterevidence is that pausing paid media can lift organic traffic while total traffic still falls. Anyone arguing the efficiency case has to sit with that result rather than around it.
Amsive documented a 10-day paid media blackout and what happened to organic: organic search traffic rose 21%, total site visits still dropped 17% vs. a normal, fully operational week, and leads fell 54%. Organic picked up some of the slack. It didn’t pick up all of it, and leads are the number that should slow you down. Real uplift from pausing and real opportunity cost coexist in the same test.
The evidence base also has an age bias. The Google pause study is from 2012. The Northbeam session predates the current AI answer era. Both still describe mechanisms rather than current click volumes, which is why they belong in the argument, but neither substitutes for your own numbers from this quarter.
And the search results page itself is moving under all of it. Seer’s April 2026 analysis of AI Overview effects on click-through rate, covering 53 brands and 5.47 million tracked queries, found organic click-through rate on queries showing an AI Overview fell from 3.19% in January 2025 to 2.36% in February 2026, while paid click-through rate on those same queries rose from 14.64% to 16.21%. Seer describes its findings as directional rather than causal. The practical reading for a paid media owner: the organic listing you are deciding not to cover with an ad is taking a smaller share of the clicks than it was two years ago, which raises the defensive floor rather than removing it.
A caveat on tooling, too. Some of the custom reporting referenced in public resources on this topic, including reach overlap scripts and cross-channel visibility setups, is now private and exclusive to consulting engagements. You will need your own methodology or a partner who has one.
The decision isn’t whether to run branded search; it is what size floor you can defend with a test rather than a dashboard. Platform-level ROAS will always look impressive on branded terms because it reports a recapture as an acquisition.
Start narrow. Build one view that stacks paid and organic on the same date range. Check whether branded spend clears 20% of paid search and whether you hold the number one organic position. Run one controlled reduction, set an incremental ROAS threshold the reallocation must clear, then watch the next two quarters rather than the next two weeks, because the erosion risk is real and slow.
Where you are matters for how much of this to act on. At $500K to $2M a year, do the audit and fix the campaign overlap, because the Optmyzr and Adalysis numbers say you almost certainly have some, and leave the formal test until branded spend is big enough to be worth the measurement overhead. At $2M to $10M, the test is worth running, and the floor is worth finding, one reduction at a time. Above $10M, with a measurement owner in the business, incrementality thresholds by channel should already be the standing allocation rule rather than a project.
The compounding starts once you stop paying for traffic you already own and start paying for traffic you do not.
Yes, but at a floor rather than at whatever the dashboard rewards. Branded search posted the lowest median incremental ROAS of any channel at 0.70x across 225 geo tests of DTC brands, meaning most of those clicks were already yours. The defensive case is still real: if competitors are bidding your name, Auction Insights shows pressure, and you rank below the top organic position, paid coverage earns its place. The mistake is funding brand terms as a growth channel because platform ROAS says 20x. Size the floor with a controlled reduction test, keep enough to hold the top of the results page, and move the difference to prospecting.
Put paid and organic metrics in one view over the same date range and look for paid spend rising while organic conversions stay flat or decline. That divergence is the signature of cannibalization. Then check three conditions: whether you hold the #1 organic position for your brand name, whether branded terms take 20% or more of your paid search budget, and whether Auction Insights shows competitors bidding on your name. If the first two are true and the third is not, you are probably buying clicks you already owned. Confirm it with a controlled spend reduction rather than by inference, because the view suggests the answer and the test proves it.
Use 2.31x as your working minimum threshold, since that was the median incremental ROAS across all channels in Stella’s 225 test DTC benchmark set. Performance Max came in at 2.98x and Meta at 2.92x, both above the median. Google Search Non-Branded sat at 1.46x and Google Search Branded at 0.70x, both below it. Stella recommends discounting its benchmarks by 15 to 20% for planning because its advertisers are measurement-sophisticated and self-selected, so a conservative threshold lands closer to 1.9x. Set the number per channel before a test starts, not after the results arrive, so the threshold is a rule rather than a rationalization.
Run the reduction for two to four weeks to read the immediate revenue effect, then observe for six to twelve months before you call the result settled. The short window tells you whether organic absorbs the lost paid clicks. The long window tells you whether brand demand itself erodes, which is the finding that catches brands out: in year-long tests, organic does not fully recover the lost paid volume, and declining branded search volume, softer direct traffic, and reduced control of the results page show up gradually. A revenue dip appearing six months after a cut usually means the brand protection value was underestimated, not that the test was wrong.
It can, and the effect is slow enough to miss in a single test window. Seer Interactive’s guidance describes a gradual erosion where competitors reach users earlier in the journey, branded search volume declines, direct traffic and conversions soften as awareness weakens, and the brand loses control of the messaging shoppers see first on the results page. Amsive’s 10-day paid media blackout showed the same tension from the other direction: organic traffic rose 21%, but total site visits still fell 17%, and leads dropped 54%. The answer is a floor you keep, not a cut to zero, monitored across quarters instead of weeks.