Ecommerce conversion rate optimization should begin where shoppers first decide whether to engage: the search result, landing page, and category structure. Fixing upstream leaks such as weak titles, missing product data, and mismatched intent often produces faster gains than redesigning checkout.
If your store ranks but nobody clicks, or shoppers land on a page built for a different job, checkout conversion is not the first problem. It is simply the last metric to show the damage.
If your store ranks and nobody buys, the leak is measurable. And on most of the stores we open, about half of it sits outside the checkout entirely.
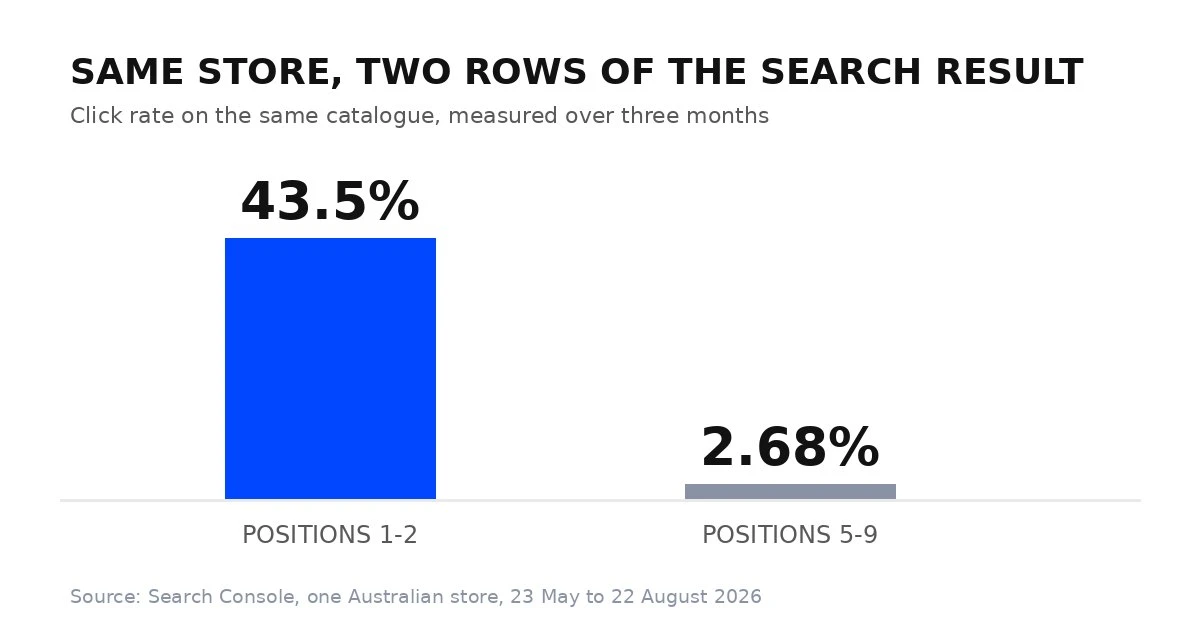
Here is the number that made that concrete. A dress boutique in Sydney sat on page one for its main categories. On positions five to nine, where most of its impressions lived, it turned 8,392 impressions into 225 clicks. That is 2.68 percent. On positions one and two the same store, the same shopper and the same brand pulled 43.5 percent. Nothing about the product changed between those two rows. What changed was what the search result said.
Ecommerce conversion rate optimization is usually written as a list of things to do on the page. This is a list of things we measured first, on two real sites, and only then changed.
Conversion rate is the percentage of visitors who take the action you are counting. Sessions that end in an order, divided by sessions, times one hundred. Change the denominator and you change the answer, which is why one store’s dashboard rarely compares with another.
Published averages for online stores sit at a low single digit, and they move with category, device, price and traffic source. A $40 accessory and a $900 gown do not convert at the same rate, and neither do paid and branded traffic. Your own baseline from last quarter is a better benchmark than anyone’s industry figure.
The number that matters more is the gap between your best step and your worst one. Ecommerce CRO is the work of finding that gap and closing it, and the gap is rarely where the last blog post you read said it would be.
Before the tactics, the shape of the problem. In the stores we audit, low conversion rates almost always trace back to one of five things, and only two of them live where conversion rate optimization is usually aimed.
The search result gives nobody a reason to click. No price, no availability, a title written for a template. The traffic report looks healthy and the click rate quietly is not, and no on-page conversion work reaches this problem at all.
The landing page answers a different question than the query. A shopper searching for dress hire in Sydney arrives on a national category page about buying. That is not a conversion problem, it is a routing problem, and no amount of button color fixes it.
Navigation makes the shopper do the sorting. If your category structure mirrors your supplier catalogue rather than the way people shop, the funnel leaks at the first click and shows up as a high bounce rate on entry pages.
The product page leaves a question open. Size, fit, delivery window, return terms. Every unanswered question is friction, and friction is what the cart abandonment number is made of.
The checkout process asks for more than the order is worth. Account creation before payment, a coupon field bigger than the pay button, payment options your customers do not hold.
The twelve fixes below map onto those five, in the order we usually find them. Each one ends with the conversion metric that tells you whether it worked.
On the boutique above, 663 indexed products carried no Product markup and no Offer. Not one. The catalogue was in the sitemap, the shopping feed was approved, the pages ranked, and Google was told nothing about price, availability or condition.
In a search result that is the difference between a listing with a price and a stock status under it, and a plain blue link. Every product now publishes price, currency, availability, condition, SKU, brand, color and size. None of that changes the product page, and all of it changes the conversion rate of the impression.
Check yours on a live product page, not in a plugin settings screen. Plenty of ecommerce sites have the plugin switched on and still ship an empty offer.
Measure: click rate on product pages in Search Console, before and after the markup ships. This is the one CRO change whose effect you can see in weeks.
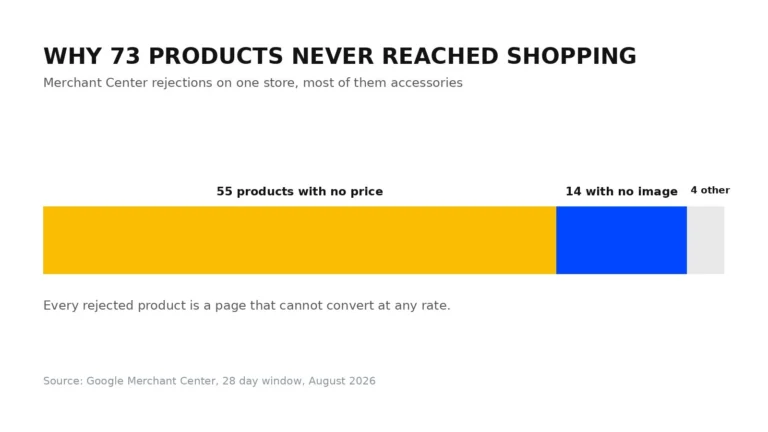
The same store had 73 disapproved products in Merchant Center. Of those, 55 had no price and 14 had no image. Almost all of them were accessories, which were the second largest traffic source on the site.
Nothing in the storefront told anyone that. The products looked fine on the site, and they were simply absent from Shopping. Rejections are the cheapest list of conversion problems you will ever get, because each line names the missing field.
Measure: approved items against total items, and the conversion rate of shopping traffic against the rest. A category missing from the feed cannot convert at any rate.
The same store’s titles were doing real damage. The formal dresses page said Australia while its heading, its slug and its top query all said Sydney. The robes category was described as sleepwear, which is a different purchase. The flower girl category had no title at all. A school formal page collected 826 impressions and zero clicks.
We rewrote 21 collection titles out of about 27, each from its own Search Console data rather than from a formula. The first nine of those covered 27,344 impressions between them at a combined click rate of 1.01 percent, which is the size of the prize on nine pages alone.
Measure: impressions, clicks and click rate per page, in the same four week window before and after. Among ecommerce CRO strategies this is the cheapest one to prove.
Thirty of the forty category pages on that store had no heading on them at all. A shopper landing from search saw a grid and a filter, and nothing that confirmed they had arrived in the right place. That is navigation failing at the moment it matters most, on the entry page.
Category pages were rebuilt as one template, so a heading, an introduction and an FAQ appear on every collection instead of on the ten that happened to have them.
Measure: bounce rate and product page views per session on category entries. A shopper who cannot confirm where they are does not go deeper.
284 products with a SKU had image titles and alt text written for them. That matters twice on a store whose customers search by fabric, color and neckline: once for image search, once for the shopper who cannot tell from the thumbnail whether the neckline is what she wants.
Most product photography advice stops at shooting better images. The cheaper win is describing the ones you already have.
Measure: image search impressions, and add to cart rate on the product pages you rewrote.
Half of that business is dress hire. 247 products had a hire counterpart recorded in the database, and nothing in the data marked them as hireable, so no template could gather them. Hire had a URL, in the sense that an old landing page existed at position 71, but no page a customer could land on and act from.
We tagged the products and built the showcase on the tag, as a live query rather than a hand-maintained list. If part of your catalogue serves a different job, it needs its own page and something in the data behind it. Otherwise that demand arrives on a page built for the other half of the business and leaves.
Measure: entrances and enquiries on the new page, and the conversion rate of the queries that used to land on the wrong one.
Three of the strongest decisions on that hire page came from the owner and made it narrower. Hire is Sydney only, because four days is not long enough for a dress to travel interstate and back. Fittings are by appointment, so no wording invites a walk-in. Sizes are stated as 6 to 20 rather than 2 to 20, because the smaller sizes in the catalogue are children’s flower girl dresses.
Every one of those removes customers. They also remove the enquiries that end in a refund, and they tell the right buyer that the page was written by someone who knows the trade. Stating a limit is a conversion tactic, even though no CRO checklist lists it as one.
Measure: enquiries that turn into orders, not enquiries. A higher conversion rate on fewer enquiries is the result you want here.
Before touching a checkout, get the drop between each step of the conversion funnel: cart viewed, checkout started, address entered, payment attempted, order placed. Without that you are guessing which step is broken, and a redesign that fixes step three while breaking step two looks like no change at all in the total.
This is the part of ecommerce CRO that survives fashion. Tactics age, a measured funnel does not.
Measure: checkout conversion rate step by step, split by device. One metric for the whole checkout process hides the step that is actually losing the order.
Ambiguous fields are where careful shoppers stall. Mark what is required and what is not, keep error messages next to the field they belong to, and make sure autocomplete fills what it claims to fill. A form that rejects a valid address twice loses a sale that was already made.
Each of those is a small piece of friction. Cart abandonment is what you call them once they have added up.
Measure: error events per form field, and the cart abandonment rate for sessions that hit one. Form fields that throw errors are the shortlist to fix first.
A large empty promo field asks every buyer whether they are paying too much. Put it behind a link. Offer the payment options your customers already hold rather than every wallet available, and let people order without creating an account. Ask for the account after the order, when it buys them order tracking.
The goal is not a shorter checkout process for its own sake. It is removing every question the shopper has to answer that does not help you ship the order.
Measure: share of orders by payment method, and the drop between payment attempted and order placed. If one payment method converts far below the others, that is a fix rather than a preference.
A training provider we work with had a course page loading 10.9 megabytes over 200 requests. Its students study on a phone between jobs, often on one bar of signal.
The images were not the problem. A reporting panel that students never see accounted for 53 percent of the weight, 5.8 megabytes of the 10.9. After the fix the same page loaded 2.7 megabytes over 76 requests, and time to DOMContentLoaded went from 2.5 seconds to 0.35.
No hosting change, no migration and no new caching plugin. Open the network panel, sort by size, and look for what your customer never sees. On mobile, page weight is the user experience, whatever the design says.
Measure: mobile conversion rate against desktop, and page weight per template. Most ecommerce brands track the first and never look at the second.
WCAG 2.2 sets a minimum target size of 24 by 24 CSS pixels for clickable controls. Quantity steppers, filter chips, swatch selectors and the close button on a size guide are the usual failures, and they fail on the exact device where most of your traffic is.
This is not a compliance chore. A swatch that needs two attempts on a phone is a product variant that does not get chosen.
Measure: rage clicks or repeat taps on controls, and the add to cart rate on mobile product pages. This is where making a purchase quietly turns into giving up.
Every change on that store went in as a named, dated snippet, with the previous values saved first.
That sounds like bookkeeping and it is the whole risk model. A live shop is taking orders while you work. A theme edit is a change nobody can find later, in a file the next update overwrites. A snippet has a name, a date and an off switch, and the values it replaced sit next to it, so a single change can be reversed without touching the others.
It paid for itself in August, when a WordPress core update landed overnight and broke part of the site. Because every change was isolated, working out what the update had broken did not mean working out what we had broken.
Pull last quarter’s Search Console data and sort the pages by impressions. Find the ones ranking between five and nine with a click rate below one percent. Those pages already have the demand. What they are missing is a reason to be chosen, and that reason is usually a price, a heading or a title that says what the page is.
Then open Merchant Center and read the rejections. It is the shortest list of specific problems in the entire business.
Then, and only then, start on the checkout. It is the most expensive place to work and the last place most stores should start, because the conversion rate there is capped by everything upstream of it.
How do you calculate your ecommerce conversion rate? Orders divided by sessions, times one hundred, over a fixed window. Keep the definition stable. If you switch from sessions to users halfway through a test, the improvement in the conversion rate you measure is the definition, not the store.
What is a good ecommerce conversion rate? Low single digits for most stores, with wide variation by category, device and traffic source. Compare against your own previous quarter and against your own best performing channel rather than against a published average. A store with a 1 percent conversion rate on cold traffic and a 4 percent conversion rate on returning customers does not have one number at all.
How does mobile conversion compare to desktop? On most stores mobile carries more traffic and converts lower. Some of that is genuine browsing behaviour and some of it is page weight, tap targets and a checkout that was designed on a large screen. Measure the conversion rate on the two separately, or the mobile problem hides inside the average.
How long does ecommerce CRO take to show results? Search result changes show up in Search Console within weeks, because the click rate responds as soon as the result is re-rendered. Checkout changes need enough orders to tell a real conversion improvement from a quiet week, which on a small store can be a full quarter. Plan the conversion optimization work in that order and you get feedback early.
Can CRO hurt your SEO? Not if you keep the content and the markup. Most of the work above adds signals rather than removing them: prices in the result, headings on pages that had none, alt text where there was none. It does hurt when a redesign strips text in the name of a cleaner page, drops a page without a redirect, or replaces headings with images. If a change removes words, check what those words were ranking for before it ships.
Vasilii Aldukhov has been building websites for ten years and runs Web Ways Tech , a Sydney studio working on WordPress and WooCommerce stores across Australia. The stores in this article are client projects, and the numbers come from their own Search Console, Merchant Center and network measurements.