

Profits are like a meal.
If you’ve prepped right, you get to sit down and enjoy. But, if you live hand to mouth, you’ll have to scramble each time. Always wondering when your next bite will come.
Feast or famine.
Is your business prepped for profits? Are you using the right ingredients? Where is there risk of spoilage?
Perhaps most importantly, what about dessert?
Ecommerce demand forecasting answers all those questions and more. It helps you predict growth, reduces uncertainty, and head off fluctuations.
Of course, ecommerce forecasting is complex. To guide you, here’s the recipe we’ll follow …
If you want to know the future, look to the past.
The struggle in ecommerce is we now have numerous avenues where cash flow is generated and more data than we can handle.
That’s where forecasting comes in …
Ecommerce demand forecasting is the process of predicting future sales by combining historical metrics — namely; previous sales, number of customers, and repeat purchases.
Accurate benchmarks to guide your marketing strategy, inventory levels, and cash flow are the ultimate goals.
Knowing what’s happened previously and comparing it to what’s happening currently allows you to see trends. If these trends are consistent, you’ll have a map for what is likely to occur in a year, five years, or more.
If they’re unfavorable, you’ll have the opportunity to avoid making the same mistakes.
Reducing risks doesn’t come from being right. It’s about mastering your business’ inputs … to better control its outputs.
Owners and operators often have a codependent relationship with pricing. We treat it as sacred and fixed when it’s actually open and elastic.
For example, you may have a best-selling product that does poorly during the summer. To keep inventory levels healthy, most retailers decease order volume from suppliers. Instead, could lowering the price off set the off-season?
Conversely, that same product may sell out during peak moments. Rather than increasing stock levels, the right answer could be to charge more.
The value of customer data cannot be overstated. Information on purchases and engagement should unlock and directly shape your digital marketing plan:
Two areas where seasonality has the greatest
During inventory planning, forecasts are used to determine customer demand for existing SKUs, new products, and even demand by location — “geographical demand” for physical or omnichannel retailers.
Some high-traffic periods are obvious, like Black Friday. Others are hidden within the past, waiting to be revealed and operationalized.
So, how do you actually forecast? You start with the right methodology …
Quantitative forecasting relies on hard data from inside your business as well as external factors outside it.
It’s a form of predictive analytics where math rules the relationship between inputs (what’s known) and outputs (what’s unknown).
Quantitative models provide you with short-term and long-term projections: if you want to calculate sales activity for next year, you would look at the sales from previous years. This is known as the time-series method.
Beyond your business, wider data sets — namely, ecommerce trends and growth rates — should also be considered. That’s why we’ve made stat-heavy guides on …
Qualitative forecasting is a short-term method used to make future predictions when there’s a lack of historical sales data.
Startups can benefit from relying on expert opinions and social proof to gather insights.
If you’re a growing business, you may not have enough customers to pull meaningful numbers. But you still need a peek into your future. Whether you have numbers or not, you can base your predictions on observational data.
Most qualitative data can be pulled from publicly available spaces where opinions and feedback are freely shared. This makes it extremely easy for businesses to access the information they need.
Original market research includes:
The Delphi Technique, which comes up often in these discussions, is based on a system of surveys and questionnaires that are completed by experts.
Now, let’s talk about cake, because everyone loves cake …
When building our models, we use the Three-Layer Revenue Cake Method that includes …

Notice, variability increases as you move up the cake. That means revenue becomes more unpredictable. The goal is to focus on factors you can control — the bottom and middle layers.
As we examine each ingredient, you can enter figures from your business into the Simplified Forecasting Template:
Existing customers provide the most reliable source of revenue. Therefore, they’re the foundation.
Look at your previous months, quarters, or years under two lenses.
First, your total revenue per period. Second, returning-customer sales versus new-customer sales.

For example, to anticipate Q4 revenue you’d examine historical performance from the previous year. This would include past customer numbers as well as their continued purchase activity.
Each subsequent month, those customers will generate more revenue at their rate of retention.

These are channels where you can reach non-customers for free: email marketing, SMS, owned keywords, and social.
Here, your organic efforts become the second set of inputs. Predictions come from each channel’s total revenue divided by …

The final layer is paid acquisition. It’s the most volatile, especially during peak seasons. Questions like …
We can’t control these factors; definitive answers don’t exist.

Nonetheless, you still need to budget your ad spend, determine your customer-acquisition costs (CAC), and arrive at a target.

Having your cake and eating it too, just not upside down …
Combining all three layers, you’ll have a complete cake to predict revenue and MER — your Marketing Efficiency Rating: total ad revenue/total ad spend.
Together they reduce the margin of error and meet goals that are rooted in what your business has the capacity to yield.
What happens when your cake is upside down?
When paid acquisition becomes the base layer, you have a recipe for volatility. Even though Common Thread Collective is known as a Facebook ad agency, the volatility of media buying is why we anchor growth strategies in accelerating customer lifetime value (LTV).
For clients — as well as our own brands — we rely on “Growth Maps.”
Adapted from Lightspeed’s Standardized Ecommerce Model, Growth Maps combine (1) past performance with (2) real-time oversight of revenue and ad spend (3) minus variable costs.
With them, we can actualize revenue in the most accurate way possible.
To help you crunch your own numbers …
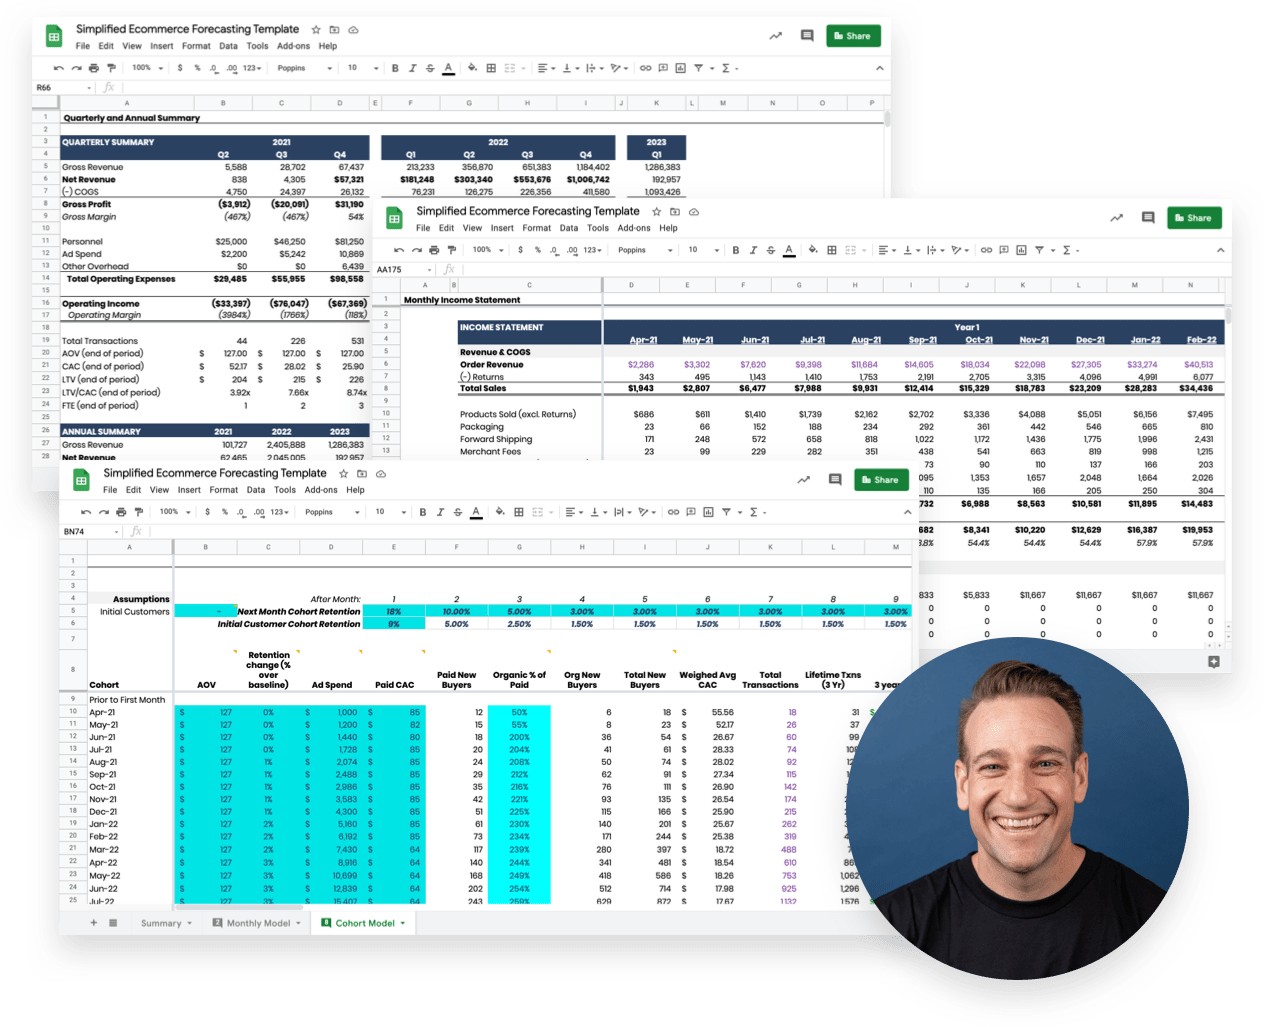
We’ve created the Simplified Ecommerce Forecasting Template. The model builds total calculations by adding up — diagonally, across each cohort — your existing customers plus the total new buyers.
Starting with current customers, input your data into the blue cells. The white cells are where calculations happen through pre-built formulas — you don’t need to touch them one bit.
Amazon, just another channel …
There are countless channels to consider. The major differences boil down to cost structure and volume capacity.
In the case of Amazon, there are both ad costs (because you have to get your product featured through Amazon Advertising) plus variable platform fees. Whether you’re a Seller or a Vendor, the more products you push, the more you have to pay.
Like other models, Amazon Forecast combines historical data and related trends. From there, businesses have the option to organize through the AWS portal, in a CSV file, or with the Amazon Forecast API that can be integrated with custom apps.

Channels may change, but methods remain the same.
Knowing where your next slice of cake is coming from will dramatically change the ecommerce game for your business.
To visualize and track performance, we’ve developed an ecommerce growth tool called Statlas. Statlas lets you pull all the metrics that fuel ecommerce growth — visitors, conversion rates, AOV, ad spend, ROAS, email, etc.
In particular, it gives you cohort-specific LTV based on a number of factors:

And there you have it.
The methods, the Simplified Ecommerce Forecasting Template, and (soon) the right tool, Statlas — your ecommerce meal recipe.
Cake included.

