

Paid social is the lifeblood of growing ecommerce brands.
Unfortunately, few owners, operators, and marketers play the game with a clear strategy on how to win.
Fewer still calculate Facebook ad costs on a single outcome: profit.
Good news. That’s exactly what this article contains: a Facebook budget calculator, step-by-step instructions, and a video tutorial.
To cover those ingredients, we’ll ask and answer three questions …

Before the acronyms, formulas, and tactics … let’s start with benchmarks.
Why? Because large and small businesses alike face the same questions:
What is a good CPM for Facebook?
What’s the average CPC?
How does that stack up against ROAS?
Finding reliable answers isn’t easy. Especially nuanced answers that separate ecommerce from other industries and distinguish between verticals. Not to mention prospecting versus remarketing.
The numbers below come from our ecommerce data newsletter — a set of ~200 online retailers totaling +$5.9 billion in sales between 2020–2022.
You’ll see two timeframes …
Don’t let those timeframes confuse you. Essentially, we’re looking back at the last 24 months, breaking them into two 12-month blocks, and comparing them year-over-year (YoY).
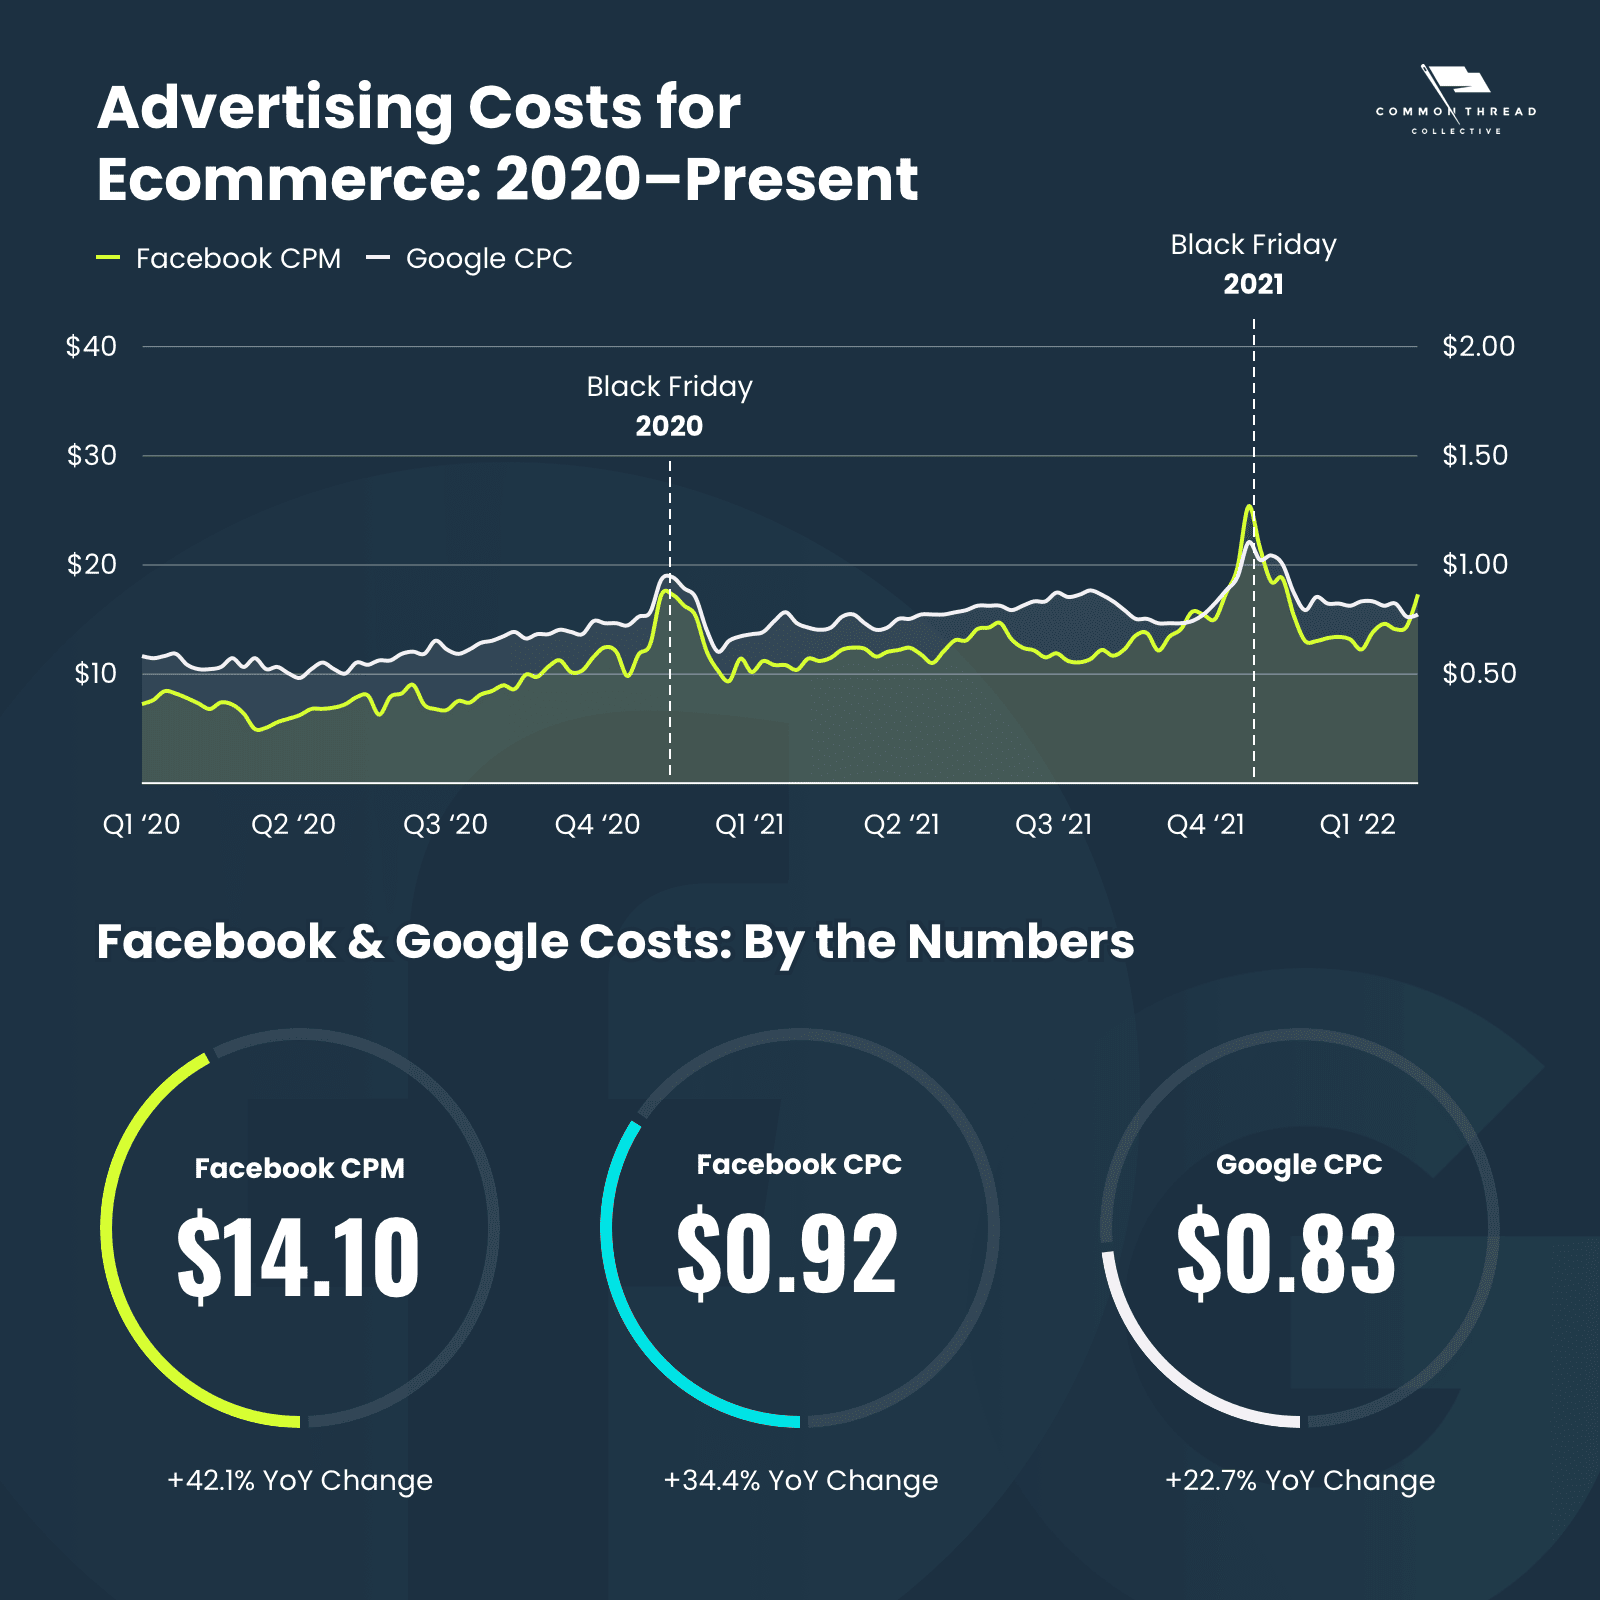
First, the big picture: Facebook and Google costs over the last two years.
Facebook CPM
Google CPC
Facebook ROAS
Google ROAS

In short, the cost to advertise has increased while the efficiency of advertising has declined. Much of that one-two punch can be traced back to post-COVID struggles, broader ecommerce trends, and the effects of iOS 14.5 on digital advertising.
Having identified the trailing 12 months’ CPM and CPC, it’s tempting to assume we have an answer to our opening question:
How much do Facebook ads cost?
Average Facebook CPM is $14.10.
Average Facebook CPC is $0.83.
However, that’s far from the full picture …
Next, let’s compare all ecommerce to its dominant verticals, separated into non-holiday versus holiday costs.

Facebook CPM TTM
Facebook CPC TTM
Google CPC TTM

Facebook CPM TTM
Facebook CPC TTM
Google CPC TTM

Facebook CPM TTM
Facebook CPC TTM
Google CPC TTM

Facebook CPM TTM
Facebook CPC TTM
Google CPC TTM

Facebook CPM TTM
Facebook CPC TTM
Google CPC TTM
For clarity — and, in particular, to highlight the differences — here are all those data points in table form:
| Industry | Facebook CPM | Facebook CPC | Google CPC |
|---|---|---|---|
| Ecommerce | $13.34 | $0.85 | $0.84 |
| Ecommerce: Holiday | $19.97 | $1.15 | $1.00 |
| Fashion | $12.66 | $0.70 | $0.55 |
| Fashion: Holiday | $18.78 | $0.92 | $0.71 |
| Health | $20.95 | $1.52 | $1.05 |
| Health: Holiday | $30.86 | $2.04 | $1.17 |
| Beauty | $20.41 | $1.17 | $1.12 |
| Beauty: Holiday | $31.95 | $1.72 | $1.53 |
| Food & Drink | $14.43 | $1.13 | $0.94 |
| Food & Drink: Holiday | $16.89 | $1.31 | $0.97 |
Finally, what are the differences between prospecting vs remarketing?
This time, we’ll use both average and median — i.e., the “middle” value — to exclude high and low outliers.
Facebook Prospecting
Facebook Remarketing (Retargeting)

So, how much do Facebook ads cost? The short answer is: More. They cost more than they used to. However, the ramifications depend on your business’ context.
The more detailed your context, the better you’ll be able to apply benchmarks to:
Of course, the far more pressing question is …
The biggest mistake ecommerce businesses make is spending money before they know why they’re spending it.
The only thing worse is “optimizing” inside Facebook Ads Manager and tweaking campaigns based on vanity metrics or short-sighted data.
What’s the solution?
Set a success target that’s built on your business’ costs. And always make it about profit.
Profit fuels growth. It guides your decisions on how to scale, how much to spend, and on what channels.
To know what Facebook ads should cost, you need to do a profitability analysis. Don’t worry, we have a calculator — the one tool you’ll need — to help you do that:
Once you’ve worked out your success target, you can then move with confidence through the metrics and acronyms to manage your Facebook advertising spend.

An impression is when someone has viewed your ad. For every 1,000 impressions, there is a cost associated with it.
Your CPM will indicate whether or not your Facebook ad campaign is cost-effective at getting the right users to see your ad.

CPC refers to how much each click from an ad to your website costs you.
You can tell when your website isn’t converting when your CTR and CPC are both high. If that’s the case, time to start optimizing onsite.

Also known as “Link click-through rate,” CTR compares how many people saw your ad to how many people clicked on it. Keep an eye on your CTR to have a better understanding of whether or not your ads are effectively creating interest — particularly your ad creative.
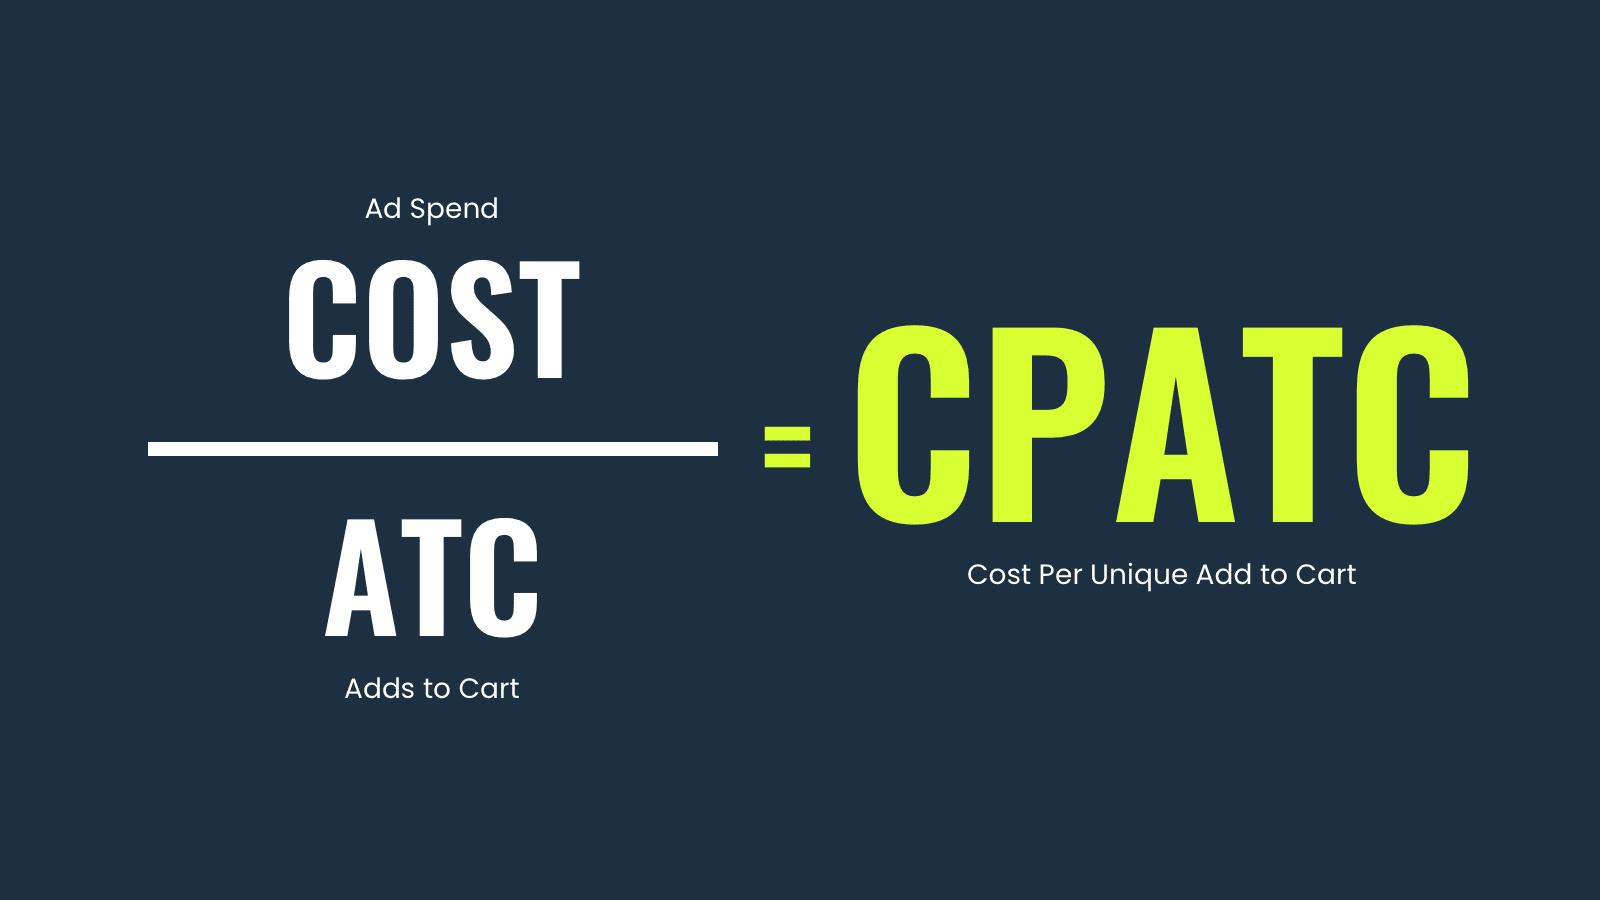
What happens if someone goes to your website through an ad, adds a product to cart, but doesn’t purchase?
We want to know how much it costs to get there. Taking your total cost divided by the number of unique adds to cart gives you cost per add to cart.

This metric takes into consideration how much it costs to get someone from add to cart to initiating the checkout process.
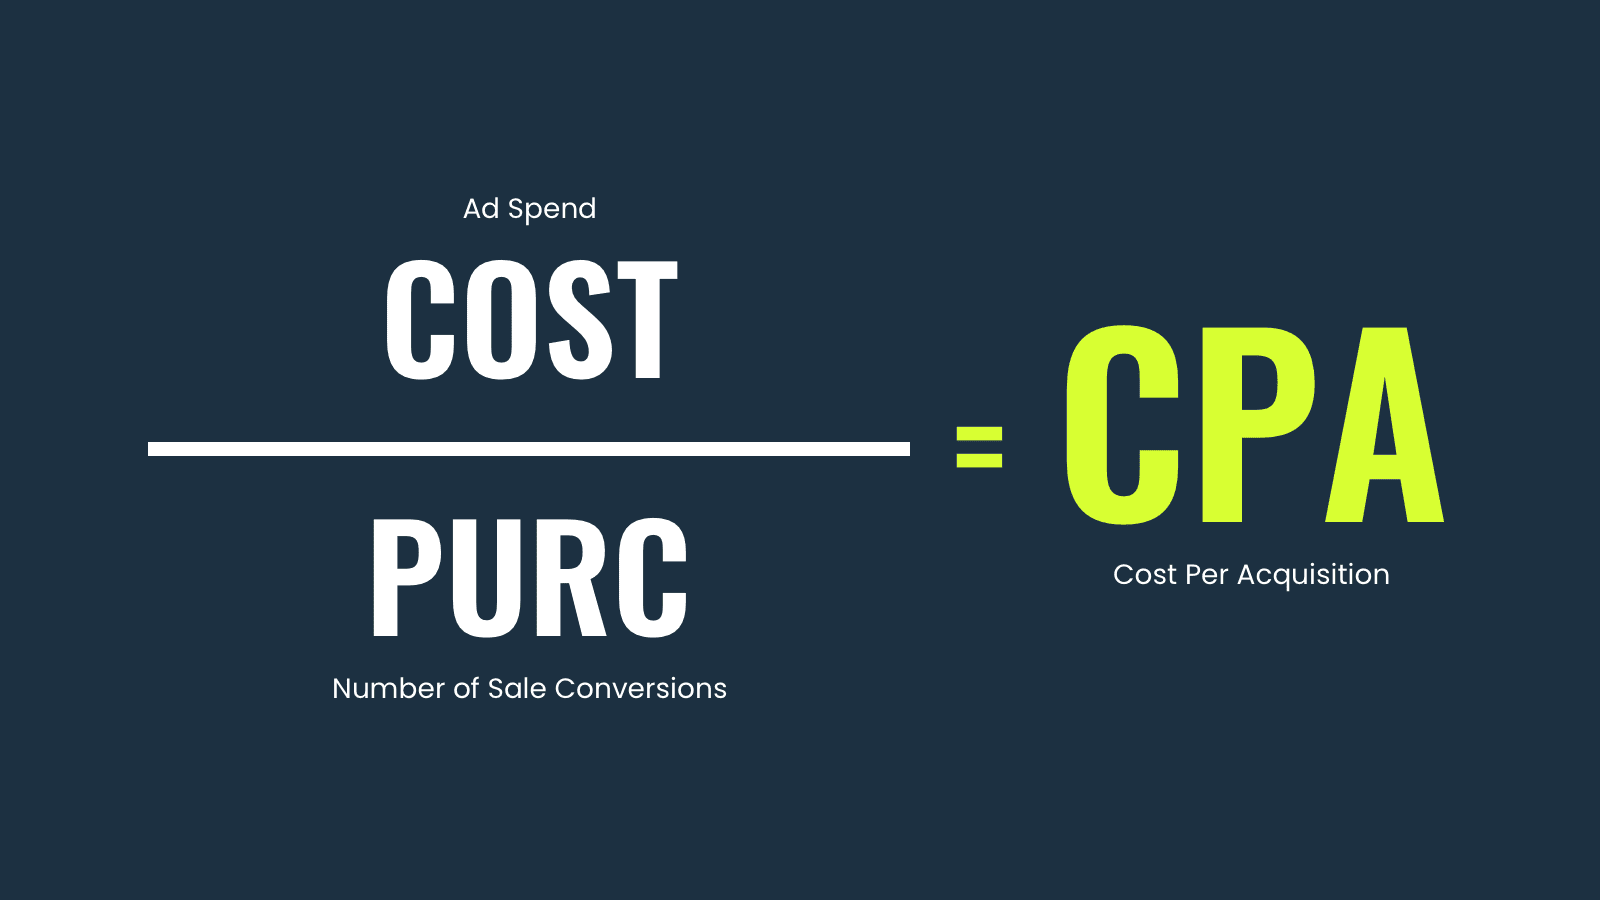
Not to be confused with cost per action — and sometimes referred to as cost per purchase (CPP) — CPA will reign supreme when we get into the Profit Analysis Calculator.
CPA is essentially your Facebook customer acquisition cost. It should be wholly set based on your business’ own targets. We’d go so far as to say that hitting your CPA target fundamentally answers the question: “How much does Facebook advertising cost for your business?”

Naturally, ROAS forces you to question how much you’re spending and how much value — real dollars back — your spend generates.
Be careful not to overly fixate on single-account ROAS targets nor to hastily adjust in real-time.
While those metrics cover the general bases, for accounts ready to scale, we can get even more tactical.
The primary dashboard view — Columns — Common Thread Collective uses for our Consolidated Ad Account Structure includes …

To set that up for yourself, simply copy and paste the following sting after your business_id= in Facebook’s Ad Manager campaign-view URL:
&columns=name%2Ccampaign_name%2Cbid%2Cbudget%2Cspend%2Caction_values%3Aomni_purchase%2Cpurchase_roas%3Aomni_purchase%2Cactions%3Aomni_purchase%2Ccost_per_action_type%3Aomni_purchase%2Cunique_actions%3Aomni_initiated_checkout%2Ccost_per_action_type%3Aomni_initiated_checkout%2Cunique_actions%3Aomni_add_to_cart%2Ccost_per_unique_action_type%3Aomni_add_to_cart%2Coutbound_clicks%3Aoutbound_click%2Ccost_per_outbound_click%3Aoutbound_click%2Coutbound_clicks_ctr%3Aoutbound_click%2Ccpm%2Creach%2Cimpressions%2Cquality_score_ectr%2Cquality_score_organic%2Cquality_score_ecvr&attribution_windows=default

CR looks at how many people on your site convert into a sale.
It helps you understand if you’re getting the most out of the traffic that is converting on your ad.
Improving your CR will help you get more sales from the same amount of traffic. When CR is low, you will need to experiment with things like improving your checkout process, introducing new creative into your social-media ads, and especially offer testing.
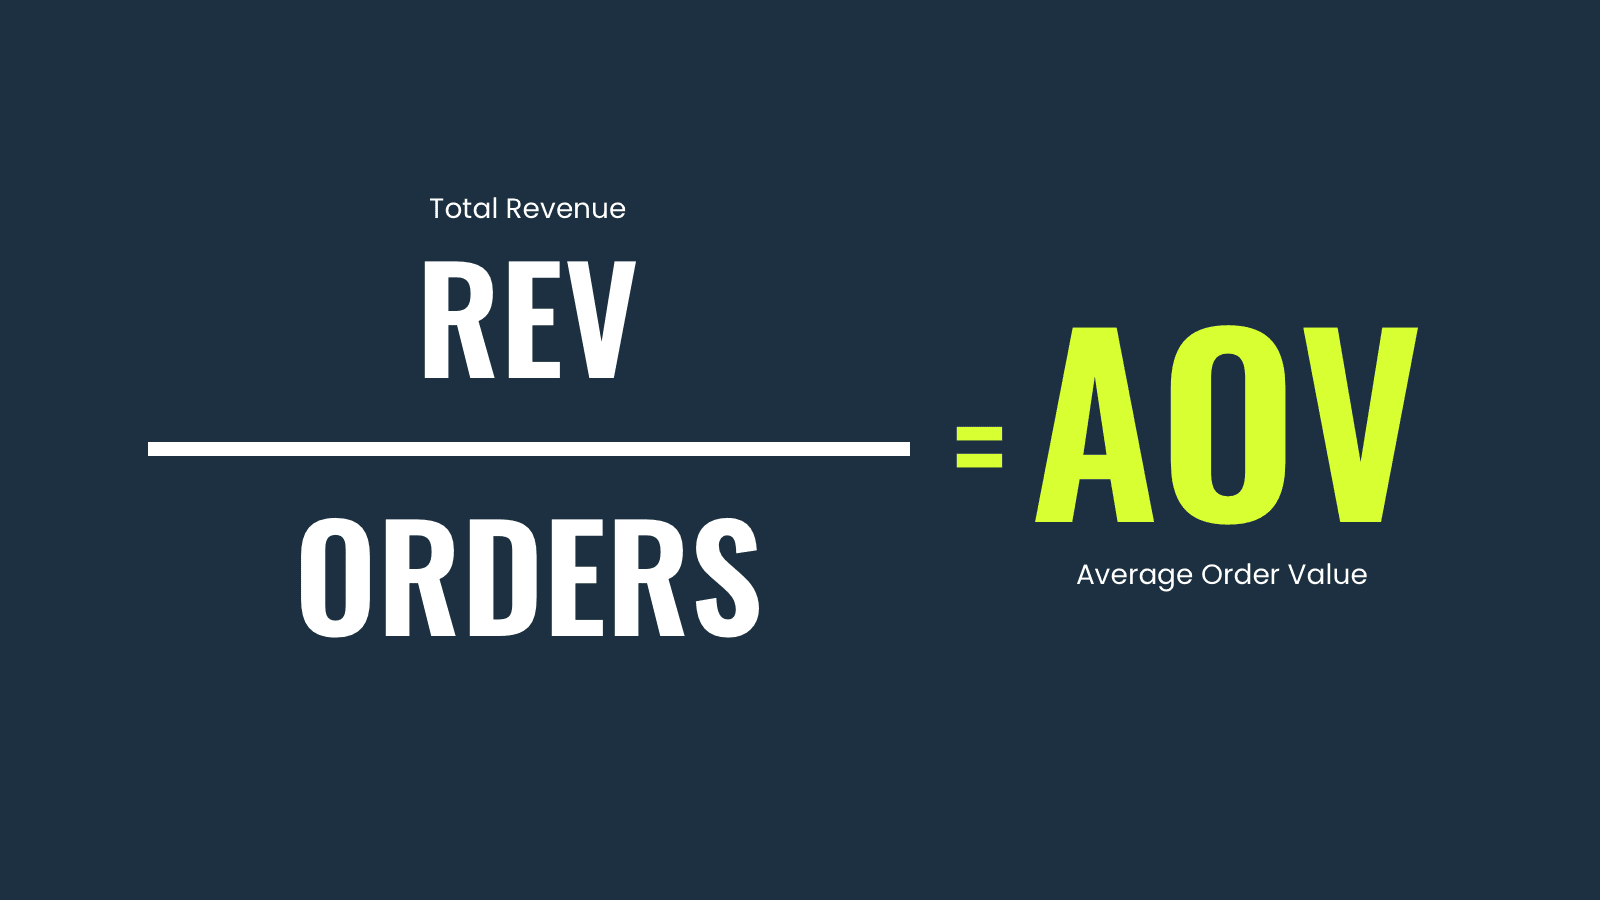
AOV helps give you a sense of how much on average someone spends on your site when they purchase. It’s a direct indicator of your revenue.
Within ecommerce, AOV varies widely across verticals: from beauty to electronics to home goods to fashion.
Typically, the higher your AOV, the more you can pay to acquire a customer.
Our final metric isn’t native to any ad network. Nor to any ecommerce platform. But it’s a North Star here at Common Thread Collective.
In fact, it’s a two-for-one.
Marketing Efficiency Ratio (MER) measures the overall performance of your online ads — in other words, the effectiveness of your digital marketing. Total revenue divided by total spend. And, total means total. Every dollar of online sales over every dollar of online spend.

Acquisition Marketing Efficiency Rating (aMER) is just as helpful. With this, you’re only including new customer revenue divided by total spend.

MER answers the question: How healthy is my overall marketing? aMER, the equally important question: How good is my marketing at attracting new customers for new growth.
A bid represents what you’re willing to pay to achieve a desired outcome. Whereas your bid strategy determines how Facebook spends that budget.
The daily budget is the total amount to spend on a specific campaign per day.
If you’re advertising products with varied AOV, you will want to set up different campaigns at different budgets, separating those campaigns either by individual SKU or categories of SKUs with similar AOVs (purchase types).
You can learn all about that in our Consolidated Ad Account Structure.
A lifetime budget lets you set an amount to spend over the lifetime of a campaign. Facebook will automatically try to evenly spread the amount that you spend across the period of time that you’ve selected.
The only variable to consider is that more or less budget may be spent on particular days if Facebook’s algorithm believes there is more opportunity on a particular day.
However, it will pare back the budget on other days to ensure you don’t exceed your lifetime budget.
Bidding strategies help you control your cost per optimization event in the same way budgets help control your overall spend.
The four ad types include:
What’s the difference?
The lowest cost bid strategy is the only automatic bid type — meaning, you are not controlling the way that Facebook spends your budget.
Instead, you’re telling Facebook to go get the lowest possible result with the creative ad audience you chose.
Oftentimes, with stores that have zero historical data or a brand new pixel and want to learn quickly while not necessarily needing to maintain profitability, lowest cost is the best route.
Choosing the bid cap strategy is a safe way to control spend according to your performance goals.
Facebook’s algorithm is smart. If it doesn’t believe it can acquire the customer you’re trying to target, it won’t spend your money.
Set bid caps 30% above your target CPA.
Cost cap is about maximizing cost efficiency by trying to get the most results at or below your desired CPA.
Let’s say your target cap cost is $25. Facebook will not spend your budget unless it can find customers at your target CPA.
At CTC, we recommend using Cost Caps above all other bid strategies.
Set cost caps right at your target CPA.
Using target cost tells Facebook to aim for the average cost to be within a 10% range of the amount you enter. Essentially, this cost control sets both a ceiling and a floor on the CPA target you are looking to achieve.
If you want to acquire a customer for $25, it will only spend within a 10% range of the amount: $27.50-$22.50. Anything below means you won’t acquire a customer above or below your target cost.
We usually recommend it if you are looking to achieve the most stable results as your spend increases and as you scale.
Set target cost at your target CPA … and gradually decrease until you lose delivery.
When you publish an ad, Facebook holds an automated ad auction among the advertisers competing for the same ad space. But the Facebook auction doesn’t function in a traditional sense.
Facebook wanted to achieve two things:
How does the process of an ad auction work? Facebook analyzes a combination of the following factors …
Facebook doesn’t give the advertiser with the highest bid automatic victory. This is on purpose to ensure Facebook is maintaining a high-quality feed experience for people using the platform.
With the user’s experience in mind, Facebook’s platform determines ad performance based on what the user’s interests are and shows them the most relevant ads based on those interests.
Facebook refers to the phrase “estimated action rates” to determine how likely a person is to act on your ad.
This assumption is based on historical ad performance, post-link click experience, and the previous actions of the user you’re targeting. The latter ties into the campaign objectives you set for your ads such as video views, conversions, or link clicks.
So, you’ve won the auction. But at what cost?
Facebook considers all of the ads competing for space and charges the winning ad the minimum amount that’s required to win.
You won’t always be charged your maximum bid.
Aside from your bid amount, there is a combination of other factors that Facebook looks at to determine the delivery and cost of Facebook Ads.
It’s supply and demand.
When you consider some of the peak ecommerce times of the year — such as Black Friday and Cyber Monday — you can bet there will be more advertisers on the platform placing bids.
The more advertisers use the platform, the higher the competition, and the more you’ll have to pay if you win.
This is why during peak online-shopping moments the CPMs on Facebook rise overall.
Facebook gives you the option to choose between automatic bid or manual bid. If you choose automatic, Facebook decides the bid amount for you. With a manual bid, it’s the amount you set and what you’re willing to spend to achieve the result you want.
Facebook grades your ad on the campaign objective you set for it (i.e., number of link clicks, video views, etc.) and whether users have reported any negative feedback.
Broadly speaking, the more specific and niche you get with your audience targeting — demographics, interests, etc. — the more expensive reaching them becomes.
It can also depend on how many other advertisers are trying to target the same audience as you.
Where your ads appear within Facebook’s ecosystem can have an effect on the cost of your bid.
Opting into automatic placements shows your ad on Instagram and the Audience Network, therefore reaching more of your audience and reducing the average cost.
Depending on what ad objective you select, Facebook will serve your ad to the people most likely to take that action:
If you don’t optimize your ad for the result you want, Facebook might not show your ad to the people who are the most likely to take the desired action you want.
Assuming your end goal is to make money, always optimize for purchase conversions.
This will ensure Facebook delivers your ad to people who are most likely to convert. You may notice your CPM and CPC are higher, but when you optimize for conversions over clicks, you get the highest possible ROAS for that ad creative and audience.
You’re telling Facebook exactly what you want: purchases.
Finally, let’s turn to one of the most important features of Facebook costs and budgets. To say we’re “all in” on CBOs at CTC would be an understatement.
Nonetheless, there are still a few things to watch out for …
Before Campaign Budget Optimization (CBO), it wasn’t as easy to track and optimize account spend because budgets were governed at the ad set level.
With CBO, you can set the budget at a campaign level and let Facebook automatically find the best active opportunities to maximize your results. As a result …

With all that love … where do CBOs go wrong.
Hint: Not at the machine level.
If you’re new to Facebook advertising, please skip this section and video.
For anyone else, let’s dive into the deep end with an overview of how Common Thread Collective scales Facebook Ads for our clients and in-house DTC brands.
Here’s the key …
Campaign budget optimization (CBO) paired with a cost cap bid strategy allows you to control the flow of spend and protect target CPA.
Imagine your campaigns as pipes automatically blocking cost per actions (CPAs) that are too high while unleashing optimal CPAs to flow through:
Think about the process of analyzing data or running a test.
The more variables you introduce, the more time and money it costs to reach statistical significance. Translation? You won’t have any actionable data to keep optimizing and scaling your spend.
Say you have a daily campaign budget of $250 governing five ad sets each with six ads within them. That’s 30 individual ads that need to be tested in order to determine a winner: 30 variables.
At a minimum, every ad needs 1x AOV to meaningfully evaluate performance: statistical significance. If you’ve got a product with a $200 AOV, the math on that is pretty straightforward:
30 (total number of variables) x $200 (AOV) = $6,000 (total spend)
If you take your total spend and divide that by the daily budget of $250, that’s 24 days until you have any actionable information from your campaign.

Solution: Accelerate your learning as much as possible by reducing the number of ad sets within your CBO.
Before CBOs, bid caps were set at CPA targets.
Now, if you set your bid cap, cost cap, or target cost too low for what Facebook thinks your audience and creative pairing can get you, it won’t spend.
This doesn’t mean that the mistake is low caps. Instead, it’s the exact opposite.
To make Facebook spend your marketing budget, you’ll be tempted to increase your cap or change your audience. Don’t.
Ultimately, this will lead to acquiring customers above your target CPA — sacrificing profitability and limiting your ability to scale.
If CBOs won’t spend your budget, it means that Facebook is not delivering your creative because it can’t find customers that will purchase at your target CPA using the creative that you have.
Solution: Be patient with your CBOs and Cost Caps. If they’re not spending at first, wait a couple of days before making any changes. If they’re still not spending, always optimize your ad creative and copy before increasing your caps.
This is the single hardest thing to do with CBOs: trust it and not touch it.
Especially when you see bad initial performance.
As a profit-sensitive media buyer (which is good) comparing two ad sets too early (which is bad) you’re knee-jerk reaction will always be to kill the one with the highest CPA (which is really bad).
Why?
Because Facebook’s platform can detect changes in trend lines and direction, it will automatically shift the budget to the ad set likely to perform better. What’s more, it’s able to analyze indicators about future performance.
As humans, all we’re able to do is look at a mere snapshot of data when trying to predict the future: our data. Facebook, on the other hand, is analyzing near exhaustive data orders of magnitude larger than what we can see.
First, stop making decisions in your ad account based on one to three days of data. Train yourself to look at larger windows of data: ideally larger than 14 days. Second, and this is the real key …
Solution: Only touch, tinker, and make manual changes within your CBOs on the ad creative itself — the ultimate human-led performance lever. Let Facebook worry about shifting your budget.
After all, that’s what it does best.
To set effective Facebook ad budgets, you need to first define your success metric and work out the specific amount you can spend on advertising as well as the return (ROAS) you need to maintain profitability.
Bidding strategies help you control your cost per action (CPA) in the same way budgets help control your overall spend.
Choosing the right bid strategy will depend on your appetite for cost control and what’s going to help you achieve your targets.
Facebook is trying to move advertisers away from tinkering in their ad accounts to trusting its machine-learning algorithm and automation.
As an owner or advertiser, this is an opportunity to focus more on your ad creative — the human side of paid media — while letting Facebook do what it still does best … find and sell better than any other social media platform.

Adrianne Austin is Growth Strategist at Common Thread Collective, where she helps some of the most-recognized DTC brands scale profitably. She’s also “mama to Valor boy,” an investor in Our Spare Change — a social enterprise creating jewelry out of high quality metals — and baked sourdough before the pandemic. If you’d like to connect, reach out to her on Twitter.

