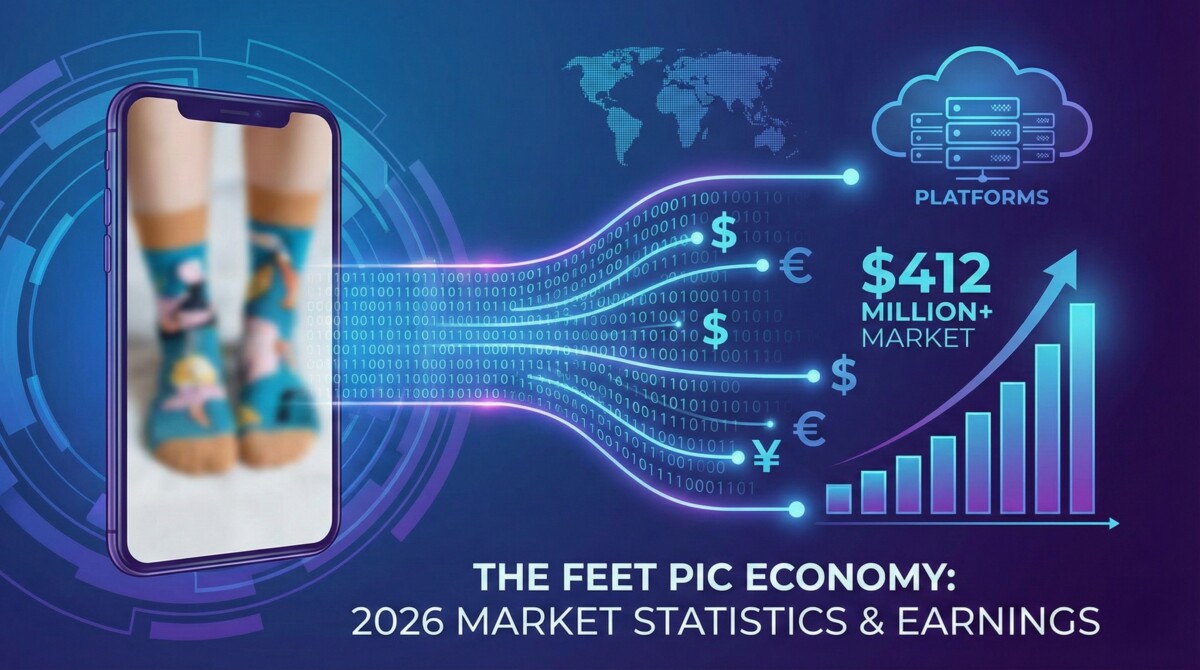
The global feet imagery market was valued at $2.1 billion in 2024 and is projected to reach $2.78 billion by 2026, according to Statista (2025). What started as a niche corner of the internet has become a professionally segmented, rapidly growing industry serving foot fetish enthusiasts, fashion brands, footwear retailers, stock photo agencies, and wellness platforms simultaneously. The data tells a story most people aren’t expecting.
Numbers don’t lie, but they do get distorted. The feet pic market is surrounded by two competing myths: one that it’s a fringe activity barely worth discussing, and another that it’s an effortless path to six-figure income. Neither is accurate.
What the data actually shows is a legitimate, professionally segmented market with real income potential for creators who approach it strategically – and real limitations for those who don’t. This article compiles verified statistics from academic research, platform data, and market analysis reports to give you the most accurate picture of this industry available in 2026.
Whether you’re considering entering the market, already selling and want to benchmark your performance, or simply curious about the economics of this industry, these numbers will give you a grounded, evidence-based understanding of what’s actually happening.
The feet pic market is larger than most people realize – and it’s growing faster than most traditional media categories.
According to Statista (2025), the global feet imagery market was valued at $2.1 billion in 2024 and is projected to reach $2.78 billion by 2026. This represents approximately 32% growth in just two years, driven by three structural shifts in the broader economy:
The feet pic market doesn’t exist in isolation. It’s a specialized vertical within the rapidly expanding creator economy, and understanding the macro context helps explain the market’s growth trajectory.
According to Precedence Research, the global creator economy market reached $254.4 billion in 2025 and is projected to grow to $313.95 billion in 2026, expanding at a 23.41% CAGR through 2035. Goldman Sachs Research estimates a more conservative but still substantial trajectory, projecting the creator economy will nearly double from $250 billion in 2024 to approximately $480 billion by 2027.
Key creator economy statistics relevant to feet pic sellers:
The feet pic market mirrors these broader creator economy patterns almost exactly – a small percentage of highly consistent, strategically minded creators earning substantial income, while the majority earn modest supplementary amounts or nothing at all.
FeetFinder is the largest dedicated feet pic marketplace and provides the clearest window into the market’s actual transaction volume. As of 2026, FeetFinder has reported:
These figures, reported in FeetFinder’s 2026 affiliate program documentation, establish the platform as the dominant marketplace for this content category and provide a benchmark for understanding market scale.
Income data for feet pic creators is where myth and reality diverge most dramatically. The market simultaneously contains creators earning $350,000 annually and creators earning $0 after paying platform subscription fees. Understanding the full income distribution – not just the extremes – is essential for realistic expectations.
Based on analysis of creator income data from multiple platform sources and creator interviews (2024-2026), the feet pic market follows a classic power-law distribution:
| Creator Tier | Monthly Income | Annual Income | Key Characteristics |
|---|---|---|---|
| Top 1% (Elite) | $5,000-$12,000+ | $60,000-$350,000+ | Full-time creators; heavy custom work; strong social following; 12-18+ months experience |
| Top 10% (Established) | $1,000-$3,000 | $12,000-$36,000 | Consistent posting; niche branding; 6-12 months experience; active social media |
| Mid-Tier (Active) | $300-$900 | $3,600-$10,800 | Regular posting; building audience; 3-6 months experience |
| Beginner (0-60 days) | $0-$200 | $0-$2,400 | Building portfolio; learning platform; limited visibility |
| Inactive/Casual | $0-$30 | $0-$360 | Sporadic posting; no marketing; often lose money after platform fees |
Sources: Tryfootly.com creator income analysis (2024-2025); StartupBooted FeetFinder review (2025); Fanso.io creator income data (2024)
FeetFinder has publicly documented several top creator earnings figures, providing verified data points for the market’s income ceiling:
These documented figures confirm that six-figure annual income is achievable – but represents the extreme top end of a very large creator pool. The vast majority of creators earn far less.
Multiple independent analyses converge on a consistent average income range for active feet pic creators:
The StartupBooted FeetFinder review (2025) found that regular sellers report selling content daily (62%) or weekly (38%) once they establish a following – suggesting that consistency of posting directly correlates with consistency of income.
A critical statistic often overlooked in income discussions: many new creators never break even on platform fees. This is one of the most important data points for anyone considering entering the market.
FeetFinder’s fee structure creates a specific break-even challenge:
At the Basic tier, a creator must earn at least $18.74/month in sales just to break even (covering the $14.99 subscription after the 20% commission is deducted). At the Premium tier, that break-even point rises to $37.49/month in sales.
For context: beginners in their first 30-60 days often earn $0-$80/month, meaning many new creators lose money during their initial months before building momentum.
This is not a reason to avoid the platform – it’s a reason to enter with realistic expectations and a 90-day commitment minimum before evaluating whether it’s working.
Understanding what content sells for provides important context for income calculations. Based on platform analysis and creator reports (2025-2026):
Photo pricing ranges:
Video pricing ranges:
Subscription pricing ranges:
For a complete guide to pricing strategy at every creator stage, see our Ultimate Guide to Selling Feet Pics.
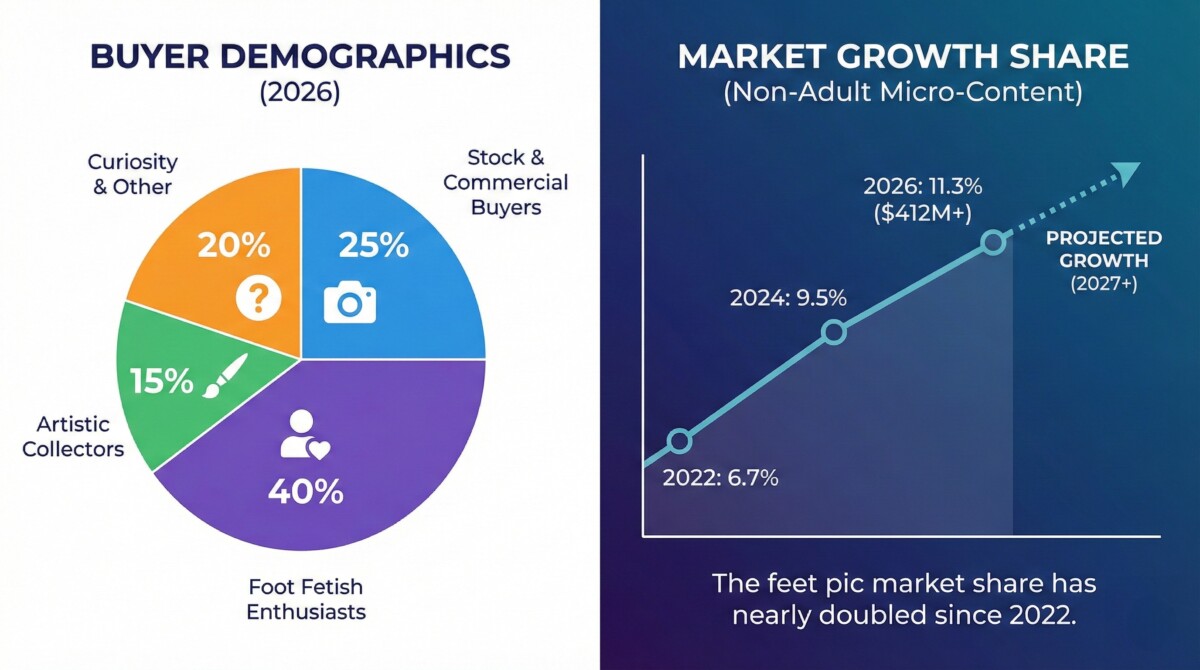
Understanding buyer demographics is essential for creators trying to create content that sells. The feet pic market serves a more diverse buyer base than most people assume – combining foot fetish enthusiasts with commercial buyers including brands, agencies, and stock photo platforms.
The most rigorous academic research on foot fetish prevalence comes from two primary sources: the University of Bologna (2006) and Dr. Justin Lehmiller’s Kinsey Institute research.
University of Bologna Study (2006) – Published in International Journal of Impotence Research:
Dr. Justin Lehmiller – Kinsey Institute Research (Tell Me What You Want):
Bedbible Research Center Study:
Belgian Population Survey (2017):
What this means for market size: Applying the conservative 14% figure to the US adult population of approximately 260 million, roughly 36 million Americans have engaged in foot-related fantasies. Even if only 1% of those individuals ever purchase feet pic content, that represents 360,000 potential buyers in the US alone.
Search volume data confirms this scale: The term “foot fetish” is searched approximately 1,713,630 times annually in the United States alone (Feetrecords.com analysis), indicating sustained, high-volume interest in this category.
Beyond the foot fetish community, the feet pic market serves significant commercial buyer segments that are often overlooked in discussions of this industry:
Stock photography platforms: Shutterstock, Adobe Stock, Getty Images, and iStock all have active demand for diverse feet imagery for use in advertising, editorial content, and commercial applications. These buyers need variety – different ages, sizes, skin tones, and contexts.
Footwear brands and retailers: Companies selling shoes, sandals, boots, and foot accessories require feet imagery for product listings, marketing campaigns, and size guides. Major brands including Nike, On Running, and Birkenstock commission feet-first lifestyle photography for campaigns targeting Gen Z and millennial consumers.
Foot care and wellness businesses: Pedicure salons, podiatry practices, foot care product brands, and wellness platforms need feet imagery for educational content, before/after documentation, and marketing materials.
Foot jewelry and accessory vendors: Sellers of toe rings, anklets, and foot chains require model feet imagery to showcase their products in an e-commerce context.
Medical and educational institutions: Podiatry schools, medical publishers, and health education platforms need clinical feet imagery for teaching materials and publications.
This commercial demand creates income opportunities that exist entirely outside the foot fetish market – and often at higher price points, since commercial licensing typically commands premium rates.
Foot fetish interest shows notable geographic variation according to available research:
For creators, this geographic data suggests that marketing efforts should not be limited to domestic audiences. International buyers represent a significant and underserved segment of the market.
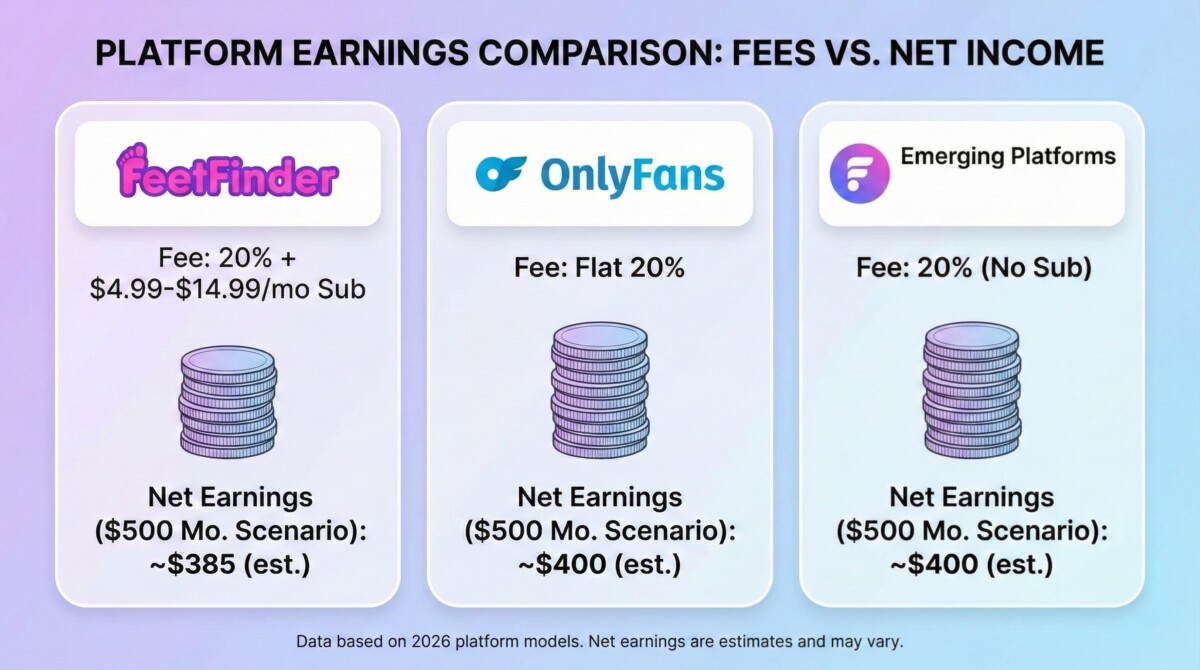
Platform choice is one of the most significant variables in creator income. The fee structures, audience sizes, and discovery mechanisms of different platforms create meaningfully different income outcomes for the same creator with the same content.
| Platform | Monthly Fee | Commission | Audience Type | Best For |
|---|---|---|---|---|
| FeetFinder | $14.99-$29.99 | 20% | Dedicated feet buyers; 8M verified users | Creators focused exclusively on feet content with 3-5x more targeted sales |
| OnlyFans | $0 | 20% | 4.19M creators; 305M+ fan accounts; general adult content | Creators who already have an existing social following to drive traffic |
| Instafeet | Approval required | Varies | Smaller, curated audience; feet-specific | Established creators seeking premium positioning |
| Footly | $0 | Higher % | Emerging platform; algorithmic discovery | New creators who can’t yet afford monthly fees; TikTok-style discovery |
| Stock Sites | $0 | 60-85% | Commercial buyers; brands; publishers | Passive income from commercial/non-adult content; portfolio diversification |
Understanding the effective fee rate (not just the stated commission) is critical for accurate income projections. Here’s what different monthly sales volumes actually net across platforms:
| Monthly Sales | FeetFinder Basic (20% + $14.99) | OnlyFans (20%, no sub fee) | Effective Difference |
|---|---|---|---|
| $50 | $25.01 (50% effective rate) | $40.00 (20% effective rate) | OnlyFans nets $14.99 more |
| $200 | $145.01 (27.5% effective rate) | $160.00 (20% effective rate) | OnlyFans nets $14.99 more |
| $500 | $385.01 (23% effective rate) | $400.00 (20% effective rate) | OnlyFans nets $14.99 more |
| $1,000 | $785.01 (21.5% effective rate) | $800.00 (20% effective rate) | OnlyFans nets $14.99 more |
| $2,500 | $1,985.01 (20.6% effective rate) | $2,000.00 (20% effective rate) | Rates nearly identical |
The data reveals a clear pattern: At low sales volumes ($50-$500/month), the subscription fee makes FeetFinder significantly more expensive on an effective basis. However, FeetFinder’s dedicated feet buyer audience typically generates 3-4x more sales volume for feet-specific content than general platforms – meaning the higher effective fee is often offset by higher total revenue.
The math favors FeetFinder once a creator consistently sells $500+/month, at which point the dedicated audience advantage outweighs the subscription cost disadvantage.
OnlyFans remains the largest general adult content platform and provides useful context for understanding the broader market:
These figures underscore an important reality: on general platforms, feet pic creators compete for attention against every other content type. The median OnlyFans creator earning $150-$180/month is likely earning less than an equivalent creator on FeetFinder, where the audience is specifically seeking feet content.
Understanding who creates feet pic content helps contextualize the market and identify where opportunities and challenges lie.
The feet pic creator market is predominantly female, reflecting both market demand (the majority of buyers seek female feet) and the broader gender distribution of adult content creators. However, the male creator segment is growing and represents a meaningful opportunity for differentiation.
Key gender data points:
Feet pic creators span a wider age range than most people assume. While younger creators (18-30) represent the largest segment, the market actively values diversity:
The data suggests that age is not a limiting factor in this market – it’s a positioning variable. Creators who understand their niche and serve it consistently outperform creators who try to compete on conventional attractiveness standards regardless of age.
One of the most persistent myths about the feet pic market is that success requires “perfect” feet by conventional standards. The data contradicts this:
Income statistics without time investment data are incomplete. Understanding the actual work required to achieve different income levels helps creators make informed decisions about whether this business model fits their lifestyle.
| Income Target | Weekly Hours | Primary Activities | Implied Hourly Rate |
|---|---|---|---|
| $200-$500/month | 3-5 hours | Photo shoots, basic editing, uploading, responding to messages | $10-$31/hour |
| $500-$2,000/month | 5-10 hours | Above + social media marketing, custom requests, audience engagement | $12-$50/hour |
| $2,000-$5,000/month | 10-20 hours | Above + video content, subscription management, brand building | $25-$63/hour |
| $5,000+/month | 20-40 hours | Full business operations; multiple revenue streams; team management | $31-$63/hour |
Note: Time estimates based on analysis of creator reports and platform activity data. Implied hourly rates assume mid-point of income range divided by mid-point of hours range.
The implied hourly rates across all tiers compare favorably to median US wages ($22.26/hour as of 2024 BLS data), particularly at the mid and upper tiers. The key variable is consistency – creators who treat this as a business with regular working hours consistently outperform those who approach it sporadically.
One of the most cited advantages of the feet pic market is its low barrier to entry. The data supports this claim, though with important nuance about the difference between minimum viable and optimized setups.
| Setup Level | Total Cost | Key Components | Expected Outcome |
|---|---|---|---|
| Minimum Viable | $15-$45 | Existing smartphone + FeetFinder Basic subscription ($14.99) + free editing apps | Sufficient to test market and make first sales; limited by phone camera quality |
| Recommended Starter | $60-$150 | Above + ring light ($20-50) + phone tripod ($10-20) + props ($10-30) + foot care products ($20-50) | Professional-looking content; competitive with mid-tier creators; suitable for $200-$1,000/month target |
| Optimized Setup | $300-$800 | Above + DSLR or mirrorless camera ($300-600) + Adobe Lightroom ($10/month) + professional lighting ($100-200) | Premium content quality; suitable for $1,000-$5,000+/month target; competitive with top-tier creators |
| Professional Studio | $1,500-$5,000+ | Above + professional camera body + multiple lighting setups + dedicated shooting space + video equipment | Top-tier content quality; suitable for $5,000-$10,000+/month target; full-time professional operations |
The data strongly suggests that the Recommended Starter setup ($60-$150) represents the optimal entry point for most new creators. The incremental quality improvement from minimum viable to recommended starter is significant, while the jump from recommended starter to optimized setup delivers diminishing returns until a creator is consistently earning $500+/month.
Any comprehensive market analysis must address the safety and legal landscape that creators operate within.
FeetFinder’s safety features, as documented in independent platform reviews (StartupBooted, 2025), include:
The independent review concluded: “The safety measures work. Mandatory ID verification, encrypted servers, and PCI-compliant payment processing create a secure environment for both buyers and sellers.”
Selling feet pictures is legal in all US states for adults 18 and over, as well as in Canada, the UK, Australia, and most European countries. Key legal considerations include:
For a comprehensive guide to privacy protection strategies, see our Ultimate Guide to Selling Feet Pics.
Understanding the trajectory of the feet pic market helps creators and analysts assess long-term opportunity. The available data points to continued growth driven by structural market forces.
Creator economy expansion: The broader creator economy is projected to grow from $254.4 billion in 2025 to $313.95 billion in 2026 (Precedence Research), with a 23.41% CAGR through 2035. As the creator economy expands, specialized niches like feet pic content benefit from increased infrastructure, better platform tools, and growing consumer comfort with direct-to-creator purchasing.
Destigmatization trend: Academic research and mainstream media coverage of foot fetish prevalence has contributed to a measurable reduction in stigma around this content category. As awareness grows that foot-related interests affect 14-18% of the male population, the market’s mainstream acceptance is likely to increase.
Commercial demand growth: The footwear industry, wellness sector, and fashion brands are increasingly commissioning authentic, diverse feet imagery for marketing campaigns. This commercial demand is growing independently of the foot fetish market and provides a parallel revenue opportunity for creators.
Platform maturation: The feet pic platform ecosystem is evolving, with newer entrants like Footly introducing algorithmic discovery mechanisms that improve content monetization for new creators. Platform competition typically benefits creators through improved features, lower fees, and better discovery tools.
International market expansion: With 60% of creator revenue already coming from international subscribers, the feet pic market has significant untapped potential in growing digital economies in Asia-Pacific, South America, and the Middle East – regions where foot fetish interest is documented to be high.
For researchers, journalists, and creators looking for the most significant data points from this analysis, here are the 20 most important statistics from verified sources:
For actionable guidance on using this market data to build a profitable feet pic business, read our step-by-step guide to selling feet pics and our comprehensive Ultimate Guide to the feet pic market.
The global feet imagery market was valued at $2.1 billion in 2024 and is projected to reach $2.78 billion by 2026, according to Statista (2025). This figure encompasses the full feet imagery market including foot fetish content, commercial photography for footwear brands, stock photo demand, wellness and podiatry content, and fashion photography. The market is growing at approximately 12-15% annually, driven by expansion in the creator economy, growing commercial demand from footwear and wellness brands, and increasing mainstream acceptance of foot fetish content. Within this broader market, FeetFinder – the largest dedicated feet pic marketplace – has processed over $100 million in total buyer spend with 12.5 million feet pics sold and 8 million verified users as of 2026.
Multiple academic studies provide consistent data on foot fetish prevalence. Dr. Justin Lehmiller of the Kinsey Institute, surveying more than 4,000 Americans, found that 14% of participants reported having had a sexual fantasy involving feet or toes at least once. Gender-specific data shows 18% of heterosexual men and 21% of gay and bisexual men reported foot fantasies, compared to 11% of lesbian and bisexual women and 5% of heterosexual women. The Bedbible Research Center found that 5% of individuals report a full-fledged foot fetish, while 15% acknowledge having fantasized about feet. The University of Bologna’s 2006 study (published in the International Journal of Impotence Research) found that among people with body part fetishes, 47% preferred feet and toes – making feet the most common body part fetish. Applying the 14% figure to the US adult population suggests approximately 36 million Americans have engaged in foot-related fantasies at least once.
Feet pic creator income follows a power-law distribution, meaning a small percentage of creators earn the majority of revenue while most earn modest amounts. Based on analysis of multiple platform sources and creator income data (2024-2026): new creators in their first 1-3 months typically earn $150-$500/month; active mid-tier creators earn $300-$900/month; established creators with 6-12 months of consistent posting earn $1,000-$3,000/month; and the top 1% earn $5,000-$12,000+ monthly. The highest documented earner on FeetFinder, Margarita Smith, earns approximately $350,000 annually. However, it’s important to note that many new creators never break even on platform fees ($14.99-$29.99/month for FeetFinder) in their first 1-2 months. The median income across all active creators is likely in the $200-$500/month range, with significant variation based on posting consistency, content quality, and marketing effort.
FeetFinder is the largest dedicated feet pic marketplace and offers the most targeted buyer audience for feet-specific content, but whether it’s the “best” platform depends on a creator’s specific situation. FeetFinder’s advantages include 8 million verified users specifically seeking feet content, $100 million+ in total platform transactions, robust safety features including ID verification and PCI-compliant payment processing, and a dedicated niche audience that typically generates 3-4x more feet-specific sales than general platforms. The main disadvantage is cost: FeetFinder charges 20% commission plus $14.99-$29.99/month in subscription fees, meaning creators must earn $18.74-$37.49/month in sales just to break even. For comparison, OnlyFans charges 20% commission with no monthly fee, making it more cost-effective at low sales volumes but less targeted for feet-specific content. For new creators with no existing audience, FeetFinder’s built-in buyer traffic typically justifies the subscription cost once consistent sales are established (usually by month 2-3). For creators who already have a large social media following, OnlyFans may be more cost-effective since they can drive their own traffic.
Selling feet pics has one of the lowest startup costs of any content creation business. At the absolute minimum, you need only a smartphone with a decent camera (12MP+) and a FeetFinder Basic subscription at $14.99/month – a total of $14.99 if you already own a suitable phone. For a more competitive setup, the recommended starter package costs $60-$150 and includes a ring light ($20-50), phone tripod ($10-20), basic props ($10-30), and foot care products ($20-50). This setup produces professional-looking content competitive with mid-tier creators and is sufficient for a $200-$1,000/month income target. An optimized setup costs $300-$800 and adds a DSLR or mirrorless camera ($300-600) and professional editing software like Adobe Lightroom ($10/month). A professional studio setup for full-time creators runs $1,500-$5,000+. The data strongly suggests starting with the recommended starter setup ($60-$150) and reinvesting earnings into upgrades once consistent monthly income is established. Equipment quality matters less than consistency, foot care, and marketing effort at the beginner stage.

