Most Shopify brands have one product that’s doing most of the heavy lifting on acquisition. It converts well. The CPM is manageable. It’s got hundreds of reviews and good creative behind it. You pour more budget into it because the unit economics look fine.
But “converts well” and “builds loyal customers” are two different things. And most brands don’t know whether their acquisition hero is producing one or the other.
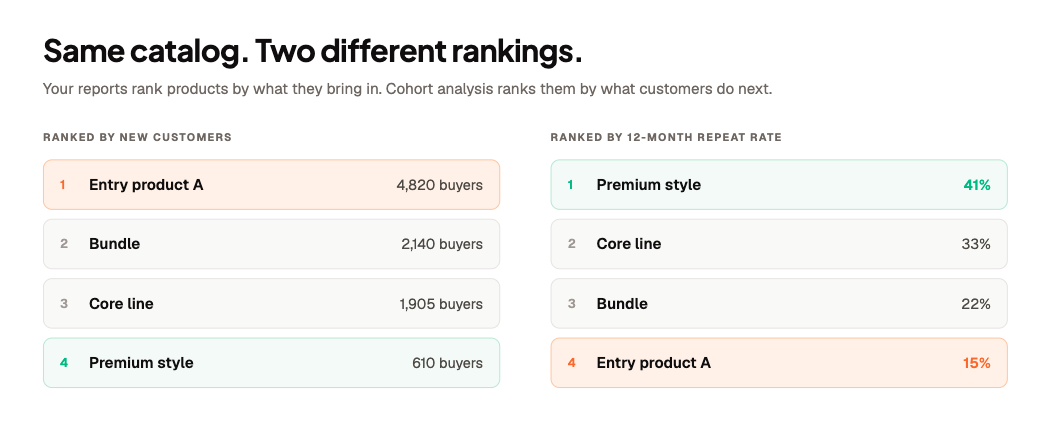
Product cohort analysis — tracking what customers who entered through a specific product do next — consistently reveals that the highest-volume acquisition products are often the worst at generating repeat buyers. The difference between a 15% and a 40% repeat rate on your top acquisition product can completely change your ad strategy.
At Tresl, we’ve analyzed customer data for hundreds of Shopify merchants — and this pattern shows up constantly.
Here’s how this plays out. You have a product that drives a big chunk of your new customer volume. By definition, it shows up everywhere — in your top products list, in your revenue reports, in your ad attribution dashboard. Everything about it says: this is working.
What those reports don’t show is what those customers do next.
Do they come back? Which product do they buy second? How long does it take? And compared to customers who entered through a different product — are they worth more or less over twelve months?
That’s product cohort analysis. And most brands aren’t doing it — not because they don’t want to, but because pulling it requires joining order data to customer lifetime data, segmenting by acquisition product, and building the comparison. That’s not a five-minute task.
Gregg E. Carey runs a hoodie brand. He knew his hoodies were popular — obviously — but he had no real sense of how hoodie buyers compared to people who entered through other categories.
When he finally pulled the numbers, the repeat purchase rate for hoodie buyers was around 40%. Other categories: 15 to 20%.
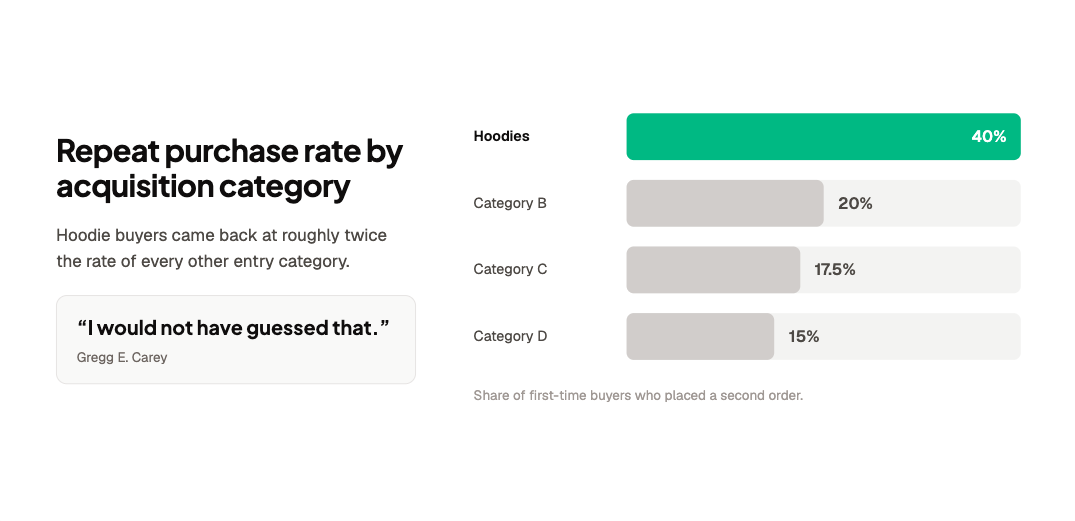
His reaction was genuine surprise: “I would not have guessed that.”
That’s not a small difference. A customer with a 40% repeat purchase rate is worth dramatically more than one at 15%. If Gregg had been running equal acquisition spend across categories, he was systematically under-investing in his best customer acquisition channel and didn’t know it.
The data was in his store the whole time.
Soft Services makes skincare. They have a scrubber — a lower-priced product that they used as an entry point to acquire new customers. Great for top-of-funnel. Accessible price, easy to try, good creative.
The assumption was that customers who started with the scrubber would stick around. It was a gateway to the rest of the line.
The actual data said something different.
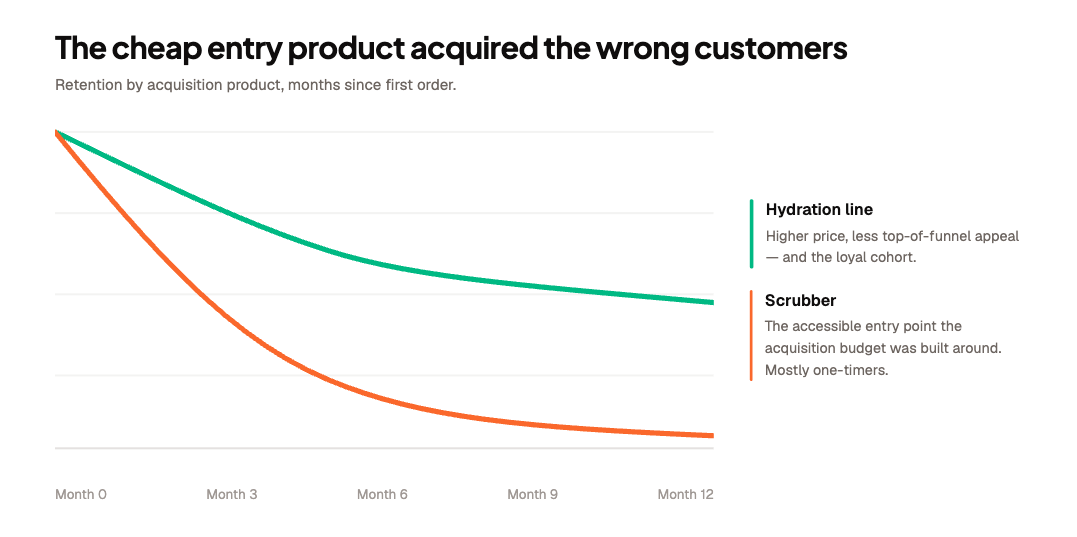
Customers acquired through the scrubber had dramatically lower repeat rates than customers who entered through Soft Services’ hydration products. The expensive, less-sexy part of the line was producing the loyal customers. The freebie acquisition driver was producing one-timers.
This was the exact opposite of what the team assumed. And they had been spending on acquisition based on the assumption.
Think about the compounding effect of that mistake. Every dollar optimized toward the scrubber for the sake of affordable entry was, in practice, acquiring customers who were unlikely to come back. Every dollar that could have gone toward the higher-ticket, higher-CLV entry products was being left on the table.
The discovery didn’t come from a gut feeling. It came from asking: which products are producing the most loyal customers?
A hijab brand had a similar situation, but the wrinkle was in where the ad budget was going.
Their full-coverage style — a more premium product — had 3x higher customer lifetime value than their entry-level styles. The loyal customers, the repeat buyers, the people who referred their friends — they skewed heavily toward the full-coverage product.
But the ads were optimized toward the entry products. Why? Lower CPM. Easier to get the click.
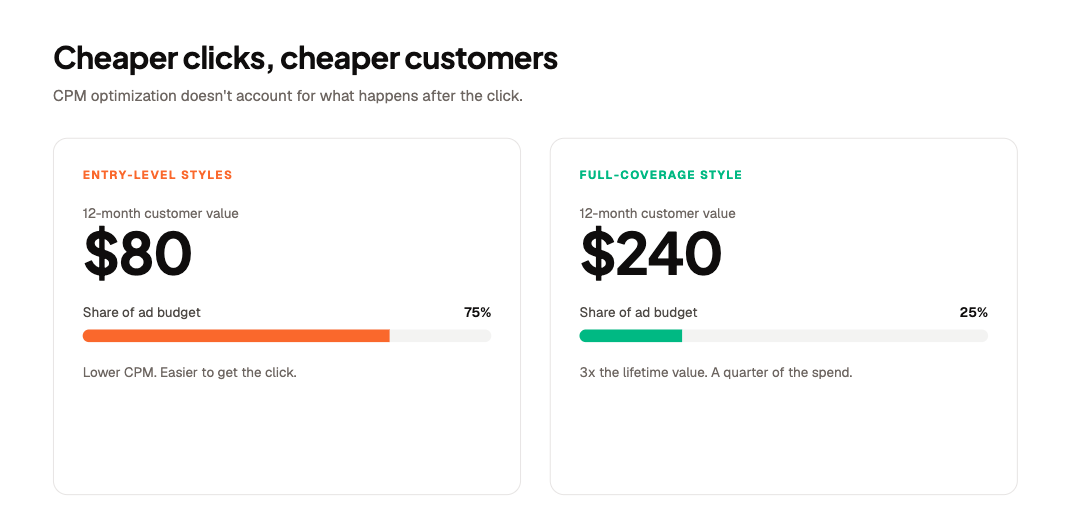
The problem is that CPM optimization doesn’t account for what happens after the click. If your lower-CPM entry product produces customers worth $80 over twelve months, and your higher-CPM premium product produces customers worth $240, the economics of that ad spend look completely different once you run them through CLV.
The brand didn’t know any of this until they asked.
“Which products are producing the most loyal customers?”
That’s a question you can now just ask — type it into Segments AI chat mode and get the breakdown across your catalog. Sort by repeat purchase rate. Sort by 12-month CLV by acquisition product. Pull the comparison between your top two acquisition drivers.
The output isn’t just interesting — it’s directly actionable. It tells you which products deserve more ad budget, which ones are costing you repeat revenue, and where to focus your email flows for new buyers.
You might find out your acquisition hero is a CLV villain. You might find, like Gregg, that your best customer acquisition vehicle was sitting right there and you just hadn’t noticed.
Either way, you want to know.
If you want to ask your own customer data questions like this, try Segments AI free — no SQL, no dashboards, just ask.