
Your next growth dollar should address the constraint with the strongest expected contribution-margin return within your cash-flow window. For stores with qualified traffic, that can mean conversion, order value, or retention. For newer stores, acquiring enough relevant visitors to validate demand often comes first.
More traffic is a growth strategy only when the customers it brings leave enough margin to fund the next round.
An online growth strategy starts with your weakest revenue lever, not your ad budget. For stores with steady traffic, that’s often conversion, order value, or repeat purchasing. For newer stores, it may be qualified traffic. Fix the constraint, then scale what pays back.
What you’ll learn
An online growth strategy is a ranked plan for improving the numbers that produce your revenue, starting with whichever one is holding the business back.
For any period, revenue equals sessions × conversion rate × average order value (AOV). That formula already counts every order, from new and returning customers alike, so repeat purchasing isn’t a separate multiplier inside it. Retention matters in a different way: it decides how much each customer is worth over time, which the retention section covers.
Because the three terms multiply, small gains compound. Lift each by 10% and revenue rises about 33% (1.1 × 1.1 × 1.1 = 1.331). Lift sessions alone by 10% and revenue rises 10%.
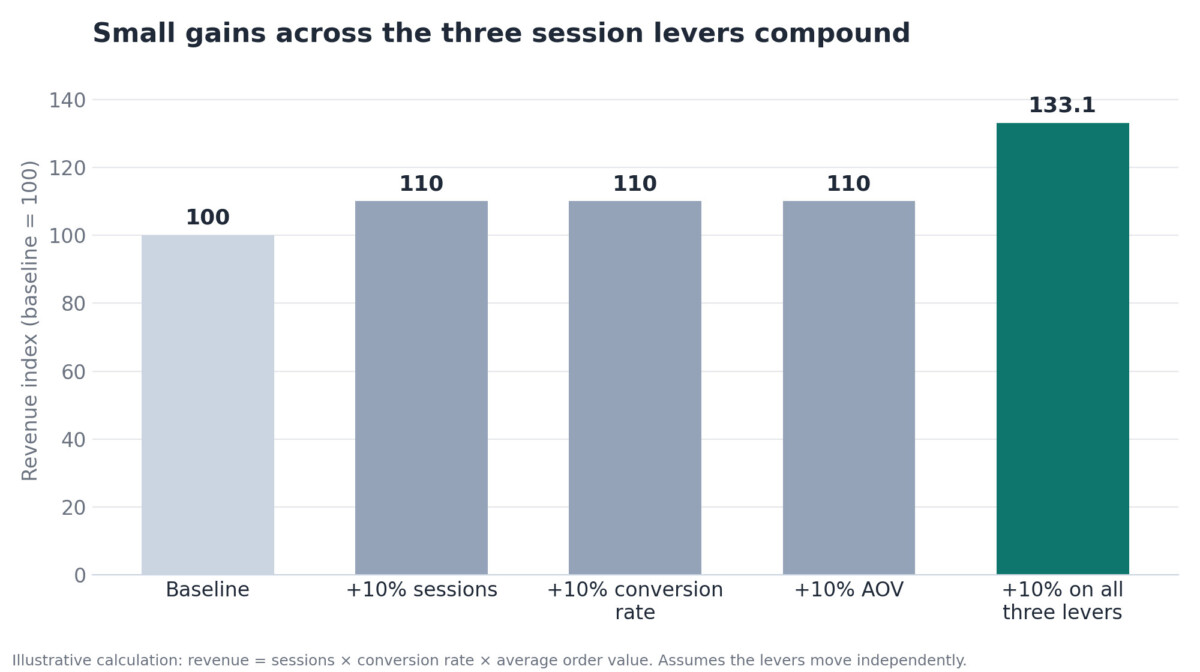
Illustrative calculation: revenue = sessions × conversion rate × average order value.
Real levers don’t move independently, though. Traffic from colder audiences often converts at a lower rate, and a free-shipping threshold that raises AOV can hurt conversion if it’s set too high. Treat the compounding math as a reason to work on more than one lever, not as a forecast.
That’s where strategy earns its name. A tactic is “run a sale” or “launch on TikTok.” A strategy decides which lever is weakest right now, what you’ll change to move it, and what you’ll deliberately ignore this quarter. The strongest growth strategies read like ranked lists, not wish lists.
Some channels touch several levers at once, and email is the classic example. As eCommerce Fastlane’s email marketing guide lays out, welcome and cart flows can lift conversion, lifecycle sends can put higher-value products in front of the right customers, and win-back campaigns can bring lapsed buyers back.
Before you read further, pull your sessions, conversion rate, and AOV for the last 90 days, plus the share of first-time customers who ordered again. You’ll use all four in the sections ahead.
If you already have qualified traffic and measurable conversion problems, fixing those problems may be a better investment than buying additional visitors. Compare the expected contribution-margin gain with implementation and testing costs before deciding.
Take an illustrative store with 20,000 monthly sessions, a 1.5% conversion rate, and a $60 AOV. It books 300 orders and $18,000 in monthly revenue. Here’s how three different moves compare:
| Scenario | Sessions | Conv. rate | AOV | Orders | Revenue | Main cost |
|---|---|---|---|---|---|---|
| Baseline | 20,000 | 1.5% | $60 | 300 | $18,000 | Current spend |
| Buy 20% more traffic | 24,000 | 1.5% | $60 | 360 | $21,600 | Added media spend every month it runs |
| Lift conversion 20% | 20,000 | 1.8% | $60 | 360 | $21,600 | Design, development, and testing time, plus upkeep |
| Lift conversion 20% and AOV 10% | 20,000 | 1.8% | $66 | 360 | $23,760 | As above, plus bundle or offer costs |
The traffic row assumes new visitors convert as well as existing ones, which often isn’t the case.
Rows two and three reach the same revenue by different routes. Bought traffic costs money for as long as you keep it running. Conversion work costs time and money up front, and it needs maintenance: new apps, theme updates, price changes, and a shifting traffic mix can all erode a gain. Neither route is free, so price the build work too when you compare them. If you lack in-house developers, agencies such as Chooli Digital Marketing can help implement online growth strategies that combine website improvements, SEO, and paid advertising.
The order flips for newer stores. With only a few hundred sessions a month, you can’t tell whether a checkout change helped or the week was simply quieter. At that stage, a modest amount of qualified traffic is how you learn which products, messages, and audiences work. The staged advice at the end of this guide covers that case.
When you do have the volume, diagnose before you redesign. Funnel reports, session recordings, and heatmaps help show where shoppers stall. This roundup of conversion tools covers the options for seeing how people move through a store. Start with the step that loses the most people.
Checkout friction and slow mobile pages are two of the most common places stores lose buyers, and both can be measured.
Some abandonment is normal. Baymard Institute calculates an average cart abandonment rate of 70.22% across 50 separate studies, and its survey found that 42% of US online shoppers have left a cart because they were only browsing. Set those shoppers aside, and the remaining reasons are largely within a store’s control.
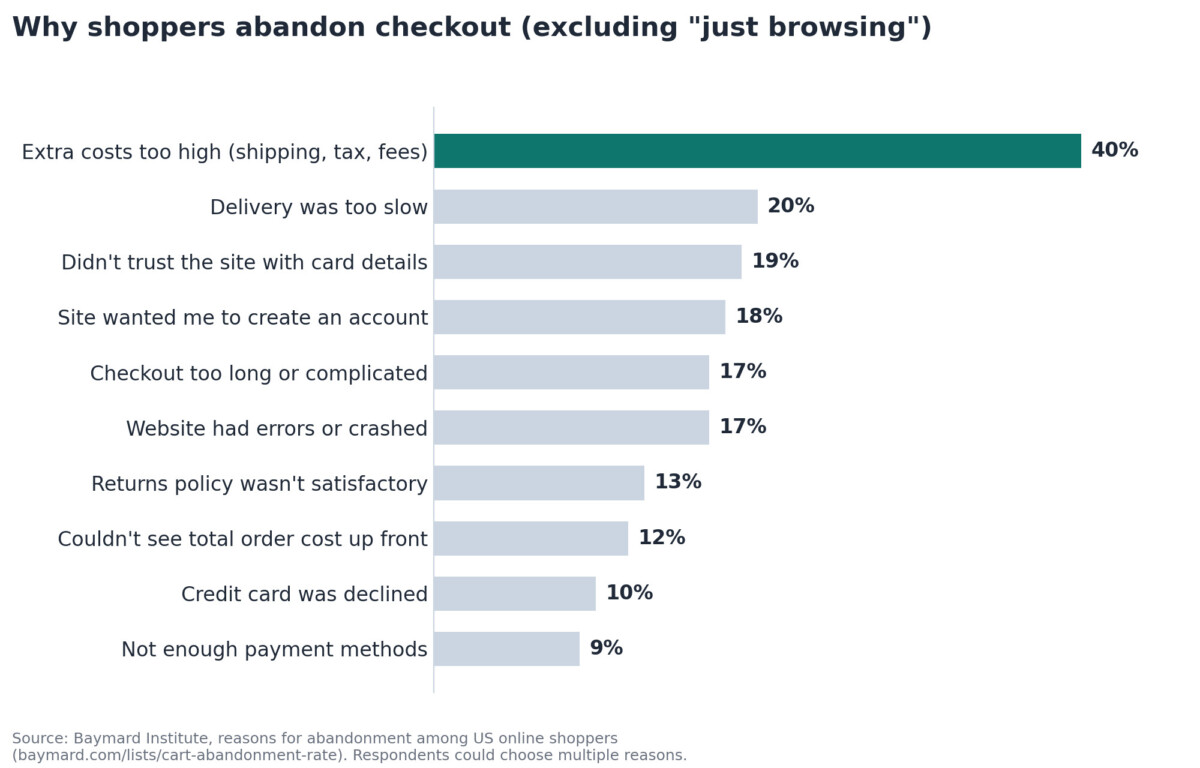
Source: Baymard Institute, reasons for abandonment among US online shoppers. Shoppers could select more than one reason.
Unexpected extra costs lead the list by a wide margin, followed by slow delivery, doubts about payment security, and forced account creation.
Checkout length matters too. Baymard’s 2024 checkout benchmark found the average checkout had 11.3 form fields, while its usability testing indicates most sites need only 8. Baymard also estimates that an average large ecommerce site could raise conversion by 35.26% by fixing the checkout usability issues its research has documented. That figure is an estimate across large US and EU sites, not a result any single store should expect, but it shows how much room many checkouts leave.
The practical fixes follow from the chart. Show shipping costs or a free-shipping threshold on the product page. Offer guest checkout. Remove fields you don’t need. Place trust signals next to payment fields, and give a delivery date estimate instead of a vague window.
Merchants often test on fast laptops over office Wi-Fi, which hides problems customers see on phones. Google’s Core Web Vitals measure real-visitor experience, and Google publishes these thresholds, assessed at the 75th percentile of page visits:
| Metric | What it measures | Good | Poor |
|---|---|---|---|
| Largest Contentful Paint (LCP) | Loading | 2.5 seconds or less | Over 4 seconds |
| Interaction to Next Paint (INP) | Responsiveness | 200 ms or less | Over 500 ms |
| Cumulative Layout Shift (CLS) | Visual stability | 0.1 or less | Over 0.25 |
Check the Core Web Vitals report in Google Search Console for your product and collection templates, since those pages usually carry the most revenue. Heavy apps, uncompressed hero images, and third-party scripts are frequent causes of poor scores.
Retention determines how much a customer is worth over time, and that value sets the ceiling on what you can afford to pay to acquire one.
The session formula tells you this quarter’s revenue. It doesn’t tell you whether the customers behind it come back. For that, you need customer cohorts: group customers by the month of their first order, then track what share orders again within 60, 90, and 180 days, and how much contribution margin each cohort produces.
Here’s why that matters. Suppose a first order earns $20 in contribution margin after product, shipping, and payment costs. If a cohort’s customers place 1.5 orders on average in their first 12 months, and repeat orders carry similar margin, each customer contributes about $30 that year. That $30, not the $20, is the break-even ceiling on acquisition cost for a 12-month payback under these assumptions, before overheads. It marks the point where you stop losing money, not a sensible spending target, so plan to acquire customers well below it.
The first repeat purchase is the hardest to earn. Smile.io data shared in eCommerce Fastlane’s guide to customer retention, drawn from more than 1.1 billion shoppers, puts a one-time buyer’s chance of returning at 27%. The weeks after a first order are where you win or lose the second.
Three moves work across most categories. First, time post-purchase messages to how customers actually use the product. A coffee brand might send a reorder reminder shortly before a typical bag runs out rather than on a fixed weekly schedule. Second, teach before you sell. Setup guides, care instructions, and usage tips cut returns and make the next purchase feel safe. Third, reward loyalty with value such as early access or member-only products, which protects margin better than blanket discounts.
Cohort data has one more use: it shows which acquisition channels bring in customers who come back, which feeds directly into the next decision.
Choose channels by how quickly they pay back and how much control you keep, then scale only the ones that clear your margin math.
Channels differ in how much control you keep. Paid channels, like paid social, search ads, and marketplace ads, deliver traffic quickly but charge for every click or sale, and the platforms can change pricing or rules at any time. Organic channels, like search rankings and unpaid social reach, carry no per-click charge, but they depend on algorithms you don’t control and need steady investment in content and site quality. Owned assets, mainly your email and SMS lists, give you the most control, since you can reach subscribers directly. They still carry platform fees and the ongoing cost of creating campaigns, but no per-visit charge.
A healthy mix pairs one paid channel for speed with one owned asset, usually email, that lets you reach customers again without paying for each visit. Get both working before you add a third. Spreading a small budget across five platforms usually means none of them collects enough data to optimize.
Match the channel to your buying cycle. Low-cost impulse products often suit short-form video and creator partnerships. Considered purchases with long research phases tend to reward search, comparison content, and email nurturing.
Test every channel against a payback window. Compare what it costs to acquire a customer with the contribution margin that customer generates in their first 90 days. If a customer costs $40 to acquire and produces $25 of margin in that window, the channel is borrowing against future orders. That can work if your cohort data shows strong repeat buying, but it ties up cash, so scale it cautiously.
Running these tests well takes budget, creative, and analysis time that a small team may not have, which is why many merchants bring in outside help for search and paid media. Whichever partner you choose, ask them to report on contribution margin and payback rather than clicks and impressions.
It’s working when contribution margin rises over a 90-day window, not when traffic or ROAS spikes for a week.
Sessions, followers, and platform-reported ROAS can all climb while profit stays flat, especially when several ad platforms claim credit for the same sale. Keep the scorecard short:
| Metric | What it tells you | Review cadence |
|---|---|---|
| Conversion rate by device | Whether site changes are landing | Weekly |
| Checkout completion rate | Whether checkout friction is falling | Weekly |
| Average order value | Whether bundles and thresholds work | Monthly |
| Repeat rate by cohort | Whether retention is improving | Monthly |
| Acquisition payback period | Whether acquisition is affordable | Monthly |
| Contribution margin | Whether growth is profitable | Monthly |
Run the strategy in 90-day cycles. Pick one primary lever per cycle and write a specific hypothesis, such as “showing shipping costs on product pages will raise checkout completion.” Give it one owner and decide in advance what result counts as a win. At the end of the cycle, keep what worked, drop what didn’t, and choose the next lever.
This rhythm guards against a familiar problem: launching several initiatives at once and never learning which one moved the numbers.
Pull last quarter’s sessions, conversion rate, AOV, and cohort repeat rate, then make the weakest one this quarter’s focus.
What that looks like depends on your stage.
| Problem | Evidence to check | First action | Success metric |
|---|---|---|---|
| Too little qualified traffic | Relevant visits and sales or inquiries by channel | Test one channel aimed at likely buyers | Acquisition cost and contribution margin |
| Shoppers abandon checkout | Checkout completion and customer feedback | Address a documented issue, such as unclear shipping costs | Checkout completion rate |
| Low order value limits profitability | Order value, product mix, and margin | Test a relevant bundle or complementary product offer | Contribution margin per order |
| Too few customers return | Repeat purchases within a defined cohort window | Test a post-purchase or replenishment message | Cohort repeat-purchase rate |
Traffic is low and orders arrive irregularly, so you can’t yet measure small conversion changes reliably. Put a modest budget behind qualified traffic from one channel, talk to recent buyers, rewrite product pages around the objections they raise, and set up a basic welcome email. Your job right now is to learn why people buy.
Orders come in consistently and some customers return. Audit your checkout against the abandonment reasons above, test Core Web Vitals on mobile product pages, and build post-purchase flows timed to your product’s use cycle. At this stage, prioritize conversion and retention improvements when your data shows clear problems and the expected gains justify the implementation costs.
Spend is significant and results are plateauing. Break out retention and payback by acquisition channel. Cut the channels that don’t pay back within your cash window, and shift some of the savings into email and SMS, where you can reach customers without paying per visit. Scale only what clears your margin math.
Online growth spending should follow qualified demand, documented buying friction, customer contribution, and cash payback rather than a fixed allocation between advertising and website work.
Fix your website first when qualified visitors encounter documented buying friction and the expected contribution gain exceeds the cost of fixing it; otherwise, a focused traffic test can be the better investment. Review checkout completion, mobile usability, and customer feedback before funding a redesign. If traffic is too low to evaluate small changes reliably, use a modest acquisition budget to learn which audiences and offers produce demand. In either case, judge the investment against contribution margin and your available cash, not revenue alone.
A good conversion rate for a small online store is one that supports profitable acquisition within its category, price point, traffic mix, and customer buying cycle. A universal percentage is less useful than comparing your own results by device, channel, landing page, and customer type. Confirm the metric’s definition before comparing reports, because purchasing sessions and total orders are not always counted identically. Investigate persistent gaps, but account for audience differences before concluding that a lower mobile or channel conversion rate proves a website problem.
An online growth strategy shows results when the selected change has accumulated enough customer activity to evaluate its commercial effect, not after a fixed number of days. Checkout corrections and email changes act on existing demand, while organic acquisition requires additional time to develop visibility and traffic. Use 90-day cycles to organize priorities, ownership, and reviews, but extend evaluation when volume or the buying cycle requires it. Compare contribution, customer quality, and cash recovery alongside conversion, and avoid declaring success from a short promotional spike.
SEO is worth investing in for a small ecommerce brand in 2026 when relevant search demand and the expected customer contribution justify the content and technical work required. Prioritize useful product and collection pages, accessible site structure, and answers to genuine buying questions. Organic visits have no direct per-click advertising charge, but research, publishing, maintenance, and development still cost money. Evaluate the channel against your own demand and payback expectations, and use a faster acquisition test when you need evidence before committing a larger long-term budget.
You do not need an agency to build your growth strategy if your team can diagnose the constraint, implement the priority change, and measure its financial effect. Outside help becomes useful when specialist skills or execution capacity are missing. Compare an agency with a freelancer, internal hire, or smaller project engagement before committing to a retainer. Require clear ownership, access to your data, realistic assumptions, and contribution or payback reporting. The partner should improve your decision-making capacity rather than make you dependent on a dashboard you cannot interpret.
About the author
Kie Sutherland is the owner of Chooli Digital Marketing, where blended search campaigns combine SEO and paid advertising to bring qualified customers to client businesses. Each campaign is designed to deliver results you can measure. Find Kie on LinkedIn.
Online growth spending should follow qualified demand, documented buying friction, customer contribution, and cash payback rather than a fixed allocation between advertising and website work.
Fix your website first when qualified visitors encounter documented buying friction and the expected contribution gain exceeds the cost of fixing it; otherwise, a focused traffic test can be the better investment. Review checkout completion, mobile usability, and customer feedback before funding a redesign. If traffic is too low to evaluate small changes reliably, use a modest acquisition budget to learn which audiences and offers produce demand. In either case, judge the investment against contribution margin and your available cash, not revenue alone.
A good conversion rate for a small online store is one that supports profitable acquisition within its category, price point, traffic mix, and customer buying cycle. A universal percentage is less useful than comparing your own results by device, channel, landing page, and customer type. Confirm the metric’s definition before comparing reports, because purchasing sessions and total orders are not always counted identically. Investigate persistent gaps, but account for audience differences before concluding that a lower mobile or channel conversion rate proves a website problem.
An online growth strategy shows results when the selected change has accumulated enough customer activity to evaluate its commercial effect, not after a fixed number of days. Checkout corrections and email changes act on existing demand, while organic acquisition requires additional time to develop visibility and traffic. Use 90-day cycles to organize priorities, ownership, and reviews, but extend evaluation when volume or the buying cycle requires it. Compare contribution, customer quality, and cash recovery alongside conversion, and avoid declaring success from a short promotional spike.
SEO is worth investing in for a small ecommerce brand in 2026 when relevant search demand and the expected customer contribution justify the content and technical work required. Prioritize useful product and collection pages, accessible site structure, and answers to genuine buying questions. Organic visits have no direct per-click advertising charge, but research, publishing, maintenance, and development still cost money. Evaluate the channel against your own demand and payback expectations, and use a faster acquisition test when you need evidence before committing a larger long-term budget.
You do not need an agency to build your growth strategy if your team can diagnose the constraint, implement the priority change, and measure its financial effect. Outside help becomes useful when specialist skills or execution capacity are missing. Compare an agency with a freelancer, internal hire, or smaller project engagement before committing to a retainer. Require clear ownership, access to your data, realistic assumptions, and contribution or payback reporting. The partner should improve your decision-making capacity rather than make you dependent on a dashboard you cannot interpret.