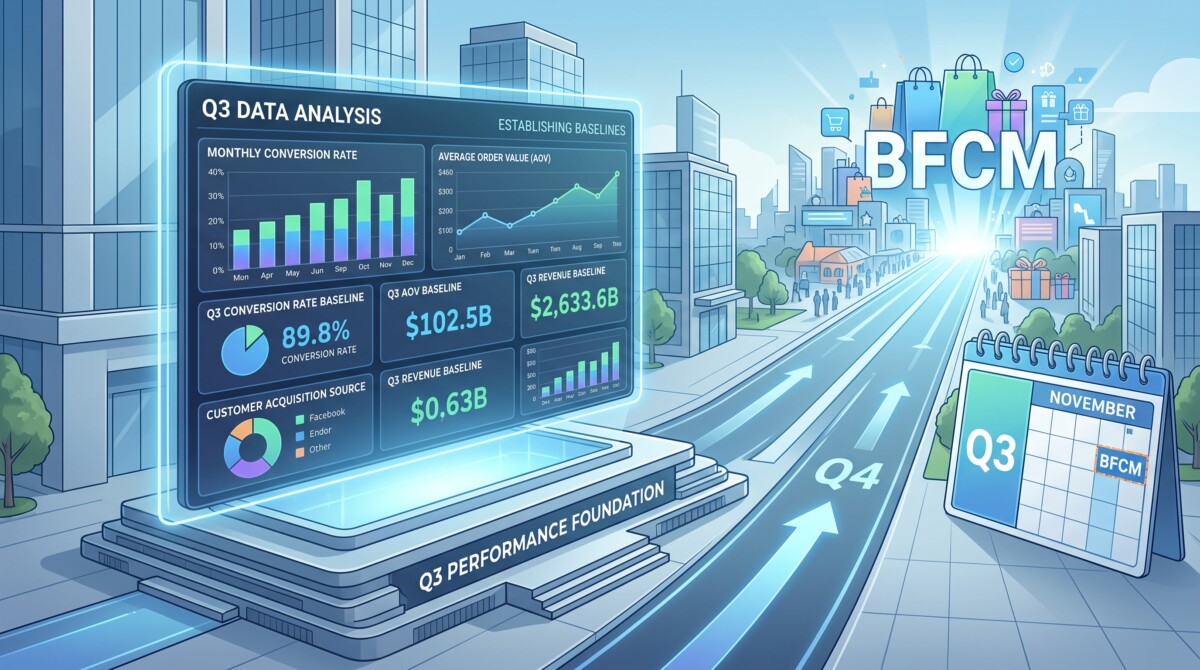
Before Q3 closes on September 30, lock five numbers as your pre-holiday baseline: customer acquisition cost by channel, conversion rate split between new and returning, average order value beside discount rate, 60- and 90-day repeat rate, and returning customer revenue share. Judge BFCM against those, not last year’s BFCM.
The most misleading comparison in ecommerce is this BFCM against last BFCM. Both numbers are bent in the same direction by the same forces, so the error shows up as consistency.
It is the second week of January. Last year’s BFCM spreadsheet is open next to this year’s, and the conversation goes the way it goes in almost every planning meeting: revenue up 18 percent, conversion rate up, average order value up, so the plan worked. Nobody asks what normal looked like in September, because nobody wrote it down.
Comparing this BFCM to last BFCM feels rigorous. It is not. Both periods are distorted in the same direction by the same forces: deep discounts that pull demand forward, gift buyers who will never return to buy for themselves, and attribution that gets noisier at exactly the moment volume peaks. When two numbers are wrong in the same way, the comparison between them looks stable and tells you very little about whether the business actually got healthier.
Q3 closes Wednesday, September 30, which makes this week the last clean window of the year to capture what your store looks like when it is simply being itself. Whether you are doing $30K months or $500K months, the job is the same: write down five numbers before October, then read the holiday against them.
Q3 is the last clean read because from October onward, nearly every metric you track starts measuring your promotions instead of your business. Early access sales begin in October, discount depth climbs through November, gift buying changes who your customers are, and paid acquisition gets more expensive as every brand in your category bids for the same attention. None of that is bad. It just means the numbers stop describing your normal operating state for roughly ten weeks.
A sitewide 25 percent offer lifts conversion rate and often average order value, but it does both by changing the price, not by improving the store. A customer buying a gift for her brother shows up as a healthy first order, then never returns because she was never really your customer. Your email list, warmed all year, makes the site look better than it is. And attribution degrades just as volume peaks, as more orders flow through coupon extensions, affiliate links, and checkout surfaces your pixels don’t fully see.
Q3 isn’t pristine either, and it doesn’t need to be. Use July 1 through September 30, or the most recent eight to ten weeks if you launched a product line or changed prices over the summer. Mark any sale weeks inside the window. Then use that same window for every number that follows, because a baseline assembled from mismatched date ranges is just five unrelated facts.
Customer acquisition cost by channel is the first number to lock, because it is the one BFCM distorts most and the one you will most want to defend in January. Calculate it as spend in a channel divided by first-time customers that channel brought in, and calculate a blended version too: total marketing spend divided by total new customers for the quarter.
Shopify’s New vs returning customers report gives you the first-time customer count for the blended number without extra tooling. For the channel split, pair each ad account’s spend with the new customers that platform reports. Those counts overlap and flatter themselves, which is fine for a baseline as long as you use the same method in January. Consistency matters more than precision.
Separate at least four buckets: paid social, paid search, affiliates and partners, and everything organic. Affiliates deserve their own line this year. As I wrote in today’s piece on which affiliate partners bring customers you did not already have, coupon and cashback partners tend to claim credit at the last moment of a checkout that was already happening, and that behavior intensifies in November. If you do not know your Q3 affiliate cost per new customer, you will not be able to tell in January whether the channel grew or just collected tolls on your own demand.
Illustrative example, not a benchmark: a store spends $18,000 on paid social in Q3 and the platform reports 240 new customers, a channel CAC of $75. Total marketing spend of $26,000 against 500 new customers gives a blended CAC of $52. Write both down. If paid social CAC is $110 in November, you now know how much of that is seasonal auction pressure you should expect and plan for, rather than a campaign that suddenly broke.
If you run a post-purchase survey, add one more figure: the share of Q3 new customers who answered each option to the question of where they first heard about you. That self-reported read is the independent check on platform attribution, and the case for treating survey answers as growth data rather than feedback gets stronger in a quarter when every dashboard is claiming the same order.
Lock conversion rate as two numbers, new visitors and returning visitors, because a blended rate hides the traffic mix shift that holiday season creates. During BFCM, returning customers and warm subscribers make up a much larger share of sessions than they do in September, and they convert several times better than strangers. The blended rate rises even when nothing about the store improved.
Here is the illustrative version. In Q3, returning visitors make up a quarter of sessions and convert at 4.5 percent; new visitors convert at 1.4 percent, and the blended rate is about 2.2 percent. In BFCM week, returning visitors grow to 45 percent of sessions. Hold both segment rates exactly where they were and the blended rate climbs to roughly 2.8 percent. That is a 27 percent improvement in the headline number produced entirely by who showed up, not by anything you did to the site.
If your analytics tool splits sessions into new and returning visitors, use those as the denominators. If it doesn’t, pull Shopify’s new vs. returning order counts and total sessions, and accept a rougher number. What you are protecting is one January question: did new visitors convert better during BFCM, or did I just have more returning ones?
The answers point to different actions. If new visitor conversion genuinely improved, something in your offer, page, or checkout is worth keeping into Q1. If only the mix changed, your holiday success came from the list you built all year, and January’s job is to protect that list rather than scale the campaign that appeared to win. Both are good outcomes. A blended rate cannot tell them apart.
Record average order value next to your discount rate, because an AOV without its discount context cannot tell you whether customers spent more or you gave more away. Calculate discount rate as total discounts divided by gross sales for the same period. Shopify’s sales reporting shows gross sales, discounts, and net sales together, so this takes a few minutes.
The two numbers move together in a way that fools people every January. A store with a $68 AOV and a 6 percent discount rate in Q3 runs a tiered BFCM offer, spend $100 and save 20 percent, and posts a $91 AOV at a 21 percent discount rate. The AOV headline is up 34 percent. Whether that is good depends entirely on contribution margin per order, and you cannot calculate that later if you did not record the discount rate that produced the Q3 number.
Capture first order AOV separately from repeat order AOV if your reports allow it. BFCM tends to inflate first order AOV the most, because new buyers arrive with a threshold offer in front of them. If you compare holiday first orders to the Q3 blended figure, you will overstate how much new customers are worth.
The discount rate is also your early warning on margin. If you are planning deeper promotions than last year, reread the Q4 2026 margin math on landed costs and weaker discount response before you set depth. Your Q3 discount rate tells you how far from normal your November plan actually sits.
The 60- and 90-day repeat rate of your summer cohorts turns January’s retention panic into a fair comparison. On September 30, customers who first bought in June have had roughly 90 days to come back, and July first time buyers have had roughly 60. Record the share of each cohort that placed a second order.
Shopify’s Customer cohort analysis report groups customers by the date of their first order and shows repeat behaviour across the following months, which is exactly the view you need. Read across the June and July rows and write down the figures at the 60 and 90 day marks. If the report is not available on your plan, export customers with first order date and order count and calculate the same two percentages in a spreadsheet.
Here is why this matters so much. BS&Co’s BFCM cohort retention benchmarks, drawn from 8,076 first time BFCM 2025 buyers across multiple DTC brands, found 11.5 percent repurchased within 90 days. That is 39 percent below the 18.8 percent annual repeat rate the same agency measured across 156,110 customers in its broader repeat purchase benchmarks, where 76.4 percent of repeat buyers came back within 90 days. BFCM buyers retain differently, and if your only comparison point in February is your all time repeat rate, the holiday cohort will look like a failure when it is behaving normally.
The same study carries a second lesson. When BS&Co followed a subset of that cohort to 300 days, about a third of the customers who eventually repurchased had been invisible at day 90, so its earlier conclusion that BFCM buyers come back fast or not at all was partly an artifact of where the window ended. The window you choose writes the story. Compare like to like: the BFCM cohort’s 90 day rate against your June cohort’s 90 day rate, not against a twelve month average.
Lock the share of revenue that comes from returning customers, because it is the clearest single read on whether holiday growth came from new demand or from your own list. Shopify’s reports split sales by new and returning customer type, so this is one filter and one division.
If returning customers produced 35 percent of Q3 revenue and 55 percent of BFCM revenue, a large part of your holiday growth was your email and SMS program harvesting customers you had already acquired. That is a good result, and it means retention work paid off. But it is not acquisition growth, and the Q1 plan that follows from “our list carried the holiday” looks very different from the plan that follows from “new customers found us at scale.”
This is also the number that exposes the most common January mistake I watched play out across merchant accounts during my years at Shopify: a record weekend, a flat first quarter, and no pre-holiday snapshot to explain the gap between them. The record weekend had been driven mostly by existing customers buying earlier and deeper than they otherwise would have. The flat Q1 was those same customers not needing to buy again yet. Without the September baseline, the founder read it as a demand problem and went looking for a new channel to fix it, which is how premature complexity starts at the $500K to $2M stage.
Freeze your measurement setup alongside the numbers, because a baseline is only comparable if the instruments that produced it stay the same through the period you compare it to. This year there is a specific reason to write the setup down before October rather than after.
Google began enrolling eligible US Shopify merchants in native checkout inside AI Mode and the Gemini app by default. Search Engine Land’s report on Google’s native AI checkout for Shopify merchants notes that certain checkout blocks, product bundles, custom pixels, and Google Analytics client side tracking are not supported in that direct checkout experience. Orders completed there still land in Shopify, but your analytics tool may not see the session that produced them. If that surface grows through November, your analytics conversion rate can fall while Shopify orders rise, and without a dated note you will misread that gap as a site problem.
Decide now whether to keep direct checkout on or switch it off under Sales channels, then Agentic, in your Shopify admin, and record the date either way. The same logic covers every AI referral surface. I covered why fixing AI referral attribution before BFCM is the highest leverage agentic task in last week’s piece, and the baseline is where that fix earns its keep.
Shopify’s reports let you add annotations to time based reports so store events appear directly on the chart. Use them. Mark the day you captured the baseline, any pixel or app change, and the start of each promotion. In January, the annotation line saves you from the question nobody in the room can answer: what changed that week?
The baseline scales with the business: three numbers in a spreadsheet at $30K a month, cohort cuts by channel above $2M a year, and the discipline is identical at both ends. The mistake at either stage is skipping it because the other version looks like the real one.
At $30K a month, skip the conversion rate split and the cohort repeat rate. A June cohort of 80 first time buyers is too small for a stable repeat percentage. Blended CAC, AOV with discount rate, and returning customer share are enough, and they fit on an index card. Resist the urge to install an analytics app to do this. The stage by stage guide to Shopify tech stack decisions makes the broader case: at this stage, new tooling is usually premature optimization, and Shopify’s default reports hold everything you need.
Above $2M, the useful extra cut is cohorts by acquisition channel. Shopify added the ability to filter the cohort analysis report by first order attributes such as sales channel and marketing channel, which lets you record whether paid social summer buyers repeat at a different rate from organic ones. That single comparison often reshapes Q1 budget more than any holiday metric does, because it tells you which channel acquires customers who stay.
In January, compare each holiday number to its Q3 baseline first and to last year’s BFCM second, and treat any gap you cannot explain as a question rather than a win. The order matters. The baseline tells you how far the holiday moved you from normal. Last year’s BFCM only tells you whether this holiday was bigger than the last one.
Four readings cover most cases. If CAC rose sharply but returning revenue share rose too, your list carried the holiday, and Q1 acquisition needs its own plan rather than an extension of the November campaign. If blended conversion rose but new visitor conversion held flat, the lift was traffic mix, not site improvement. If AOV rose in step with the discount rate, customers did not spend more of their money, they spent more of yours. And if the BFCM cohort’s 90 day repeat rate lands below your June cohort’s, that is expected. It becomes a problem only if the gap is far wider than the roughly 39 percent BS&Co measured, in which case your December post-purchase sequence is the place to look.
One more instruction for February: do not write off the BFCM cohort at day 90. The 300 day follow up showed a steady stream of second orders arriving well into the following year. Keep those customers in your campaign rotation through the summer and measure them again next September, when you capture your next baseline.
That is the real payoff. Two September snapshots, a year apart, show whether the business underneath the holidays actually got healthier, which is the question that will still matter in eighteen months when nobody remembers this BFCM’s revenue number. Pick your window tonight and fill in the first number tomorrow.
Track five metrics before Black Friday: customer acquisition cost by channel, conversion rate split between new and returning visitors, average order value alongside your discount rate, the 60 and 90 day repeat rate of your summer customer cohorts, and the share of revenue from returning customers. Capture them for Q3, ideally July 1 through September 30, before October promotions begin distorting your numbers. These five give you a normal operating baseline, so in January you can tell whether holiday results came from new demand, deeper discounts, or your existing customer list. Comparing BFCM only to last year’s BFCM hides all three, because both holiday periods are distorted in the same direction.
Divide the spend in each channel by the number of first-time customers that channel brought in over the same period, then calculate a blended version by dividing total marketing spend by total new customers. Shopify’s reports split orders by new and returning customers, which gives you the blended denominator. For the channel split, pair each ad platform’s spend with the new customers it reports. Platform numbers overlap, so the channel figures will add up to more than your real total, which is acceptable for a baseline as long as you use the same method when you recalculate after BFCM. A post purchase survey asking where customers first heard about you adds an independent check on platform attribution.
Yes, Black Friday customers typically repurchase at lower rates in the months after their first order, largely because many bought gifts or responded to a deal. BS&Co’s analysis of 8,076 first-time BFCM 2025 buyers found an 11.5 percent repurchase rate within 90 days, 39 percent below the same brands’ 18.8 percent annual repeat rate. Its 300 day follow up found about a third of eventual repeat buyers returned after day 90, so writing the cohort off early is a mistake. The fair comparison is your BFCM cohort’s 90-day rate against a summer cohort’s 90-day rate from your own store, not against your all-time average.
Use Q3, July 1 through September 30, as your BFCM baseline, because it is the last stretch of the year before holiday promotions change conversion rate, order value, customer mix, and acquisition costs. If you made a material change during the summer, such as launching a new product line or raising prices, use the most recent eight to ten weeks instead. Mark any promotional weeks inside the window and either exclude them or note them beside the figures. The most important rule is consistency: use one date range for every metric and record which range you used, so the January comparison is like for like.
It can, because Google’s native checkout in AI Mode and Gemini does not support custom pixels or Google Analytics client-side tracking, according to Shopify’s documentation as reported by Search Engine Land. Eligible US Shopify merchants with a connected Merchant Center account are enrolled by default. Orders completed through that checkout still appear in Shopify, but your analytics tool may not record the session behind them, so analytics conversion rate can fall while Shopify orders rise. Decide before October whether to keep direct checkout enabled under Sales channels, then Agentic, and add a dated annotation in Shopify reports so the change is visible when you compare holiday numbers to your baseline.