A paid click is a rental. Every channel after it decides whether you ever own the customer.
Traditional ads can still create demand. They are just no longer enough to protect ecommerce margins on their own.
A paid campaign brings a shopper to the store. What happens next decides whether that click becomes a profitable customer, a one time order, or another expensive bounce. The brands improving revenue in 2026 are not simply buying more traffic. They are connecting discovery, product data, owned channels, checkout, retention, and measurement into one system.
That is the difference between a channel that spends and a channel that compounds.
Shopify’s 2026 growth guide frames ecommerce growth around conversion lift, repeat purchase rate, expansion into new markets, channel unification, and operational efficiency. It also reports that customer acquisition costs are up between 6% and 12% year over year across ecommerce industries.
The growth question has changed. It is no longer, “Which ad platform gets the next dollar?” It is, “Which channel makes every future dollar work harder?”
This guide is written for Shopify and DTC operators who already have steady traffic and a handful of channels running, typically in the range of a few hundred thousand to a few million dollars in annual revenue, where one small team often owns several of them. If you are earlier than that, pick one section below and finish it before touching the next.
Paid ads are a starting cost, not a growth strategy, because they create reach quickly but cannot repair what happens after the click. Paid media is still useful. It tests new products, markets, offers, and creative angles faster than most organic channels can.
The problem starts when paid media is treated as the entire growth engine. A brand can improve ad targeting and still lose money if the product page does not answer objections, the checkout hides shipping costs, the post purchase journey is empty, or the customer never receives a reason to buy again.
Yotpo’s 2026 ecommerce benchmark analysis argues that the old paid arbitrage model is under pressure, citing a 40% rise in customer acquisition costs over two years. Yotpo sells retention and loyalty software, so read its framing as a vendor’s view, but the direction matches Shopify’s figures above. Its recommendation is not to abandon acquisition. It is to make retention, loyalty, and automation part of the financial model, and it treats an LTV:CAC ratio below 3:1 as unstable.
That means an ad should not be judged only by first click ROAS. Here is an illustrative example, assuming a $30 contribution margin on every order. Customer A costs $40 to acquire and buys once, so the brand is $10 behind. Customer B costs $55 to acquire and buys three times, so the brand is $35 ahead. A report that stops at the first order picks Customer A every time and quietly destroys margin. A campaign that brings in a slightly more expensive customer can still win if that customer joins an email flow, buys again within 60 days, refers a friend, leaves a review, or becomes profitable by the third order.
The first fix is measurement. Acquisition reports should connect channel, creative, product, margin, repeat purchase, refund rate, and customer lifetime value. Without that chain, the platform with the fastest attribution window often looks better than the channel creating durable revenue. Fastlane’s earlier piece on building long term visibility beyond paid advertising covers the owned and organic side of that same trade.
A useful rule: paid ads should introduce the customer, not carry the full relationship.
Product data is a revenue channel because every platform that shows your products, from search to shopping tabs to AI assistants, reads the same catalog record. Product feeds, structured data, and catalog quality used to feel like technical housekeeping. In the current ecommerce environment, they are revenue infrastructure.
Google’s product structured data guidance says merchants can provide product information through on page structured data and Merchant Center feeds, and it recommends using both. Its merchant listing documentation adds that Google may attempt to verify product data before showing it in search results, and it lists name, image, and offers as required properties, with brand, description, global identifiers, and ratings among the recommended ones.
That matters because shoppers now move between search, shopping tabs, AI summaries, marketplaces, social discovery, and direct store visits. A weak product record creates friction across all of them. A product page should not only persuade a human. It should give platforms clean information to understand price, availability, reviews, returns, shipping, variants, images, and brand identity.
The compounding effect is simple. Better product data improves organic discovery, paid shopping campaigns, on site search, AI assisted recommendations, merchandising, customer service, and remarketing accuracy. Fastlane’s AI search visibility benchmark makes the same practical point from the AI side: fix product names and data first, because that work also helps Google Shopping and on site search.
Poor product data creates the opposite loop. The wrong variant appears in a campaign. A product is marked out of stock when it is available. Reviews do not attach to the right SKU. Search engines miss key attributes. Customer support receives questions the page should have answered.
Catalog work is not glamorous, but it lowers the cost of every channel that depends on the catalog. For ecommerce teams, the new content brief should include product schema, feed accuracy, image compression, variant naming, return policy visibility, and review placement. Those details are not backend chores. They are conversion assets.
Owned channels turn intent into repeat revenue because email, SMS, loyalty, and customer accounts are where acquisition starts paying back. They are not fallback channels for when ads get expensive.
Klaviyo’s 2026 email benchmarks, based on more than 183,000 customers, show why automation matters. Campaigns account for 94.7% of send volume, but flows generate nearly 41% of total email revenue from only 5.3% of sends. Klaviyo also reports that average revenue per recipient is nearly 18 times higher for flows than campaigns. Klaviyo sells the platform, so treat these as vendor benchmarks, not a universal law. The pattern is still the clearest argument for building flows before sending another blast.
That is compounding in practice. A welcome flow turns an anonymous visit into a first purchase. A post purchase flow teaches the customer how to use the product. A replenishment flow appears when need returns. A win back flow reduces the chance that a first time buyer becomes dormant. A VIP flow rewards behavior the brand wants repeated. Fastlane’s look at why DTC subscribers cancel walks through the early order emails and win back flow for brands where the first order is a subscription.
SMS can work the same way when it is timely and permission based. Klaviyo’s SMS benchmark page reports that SMS flows make up 7.6% of sends but 45.2% of SMS revenue, with flow click rates near 10%, about double campaigns. One caveat is worth knowing: the same page reports that 64.4% of SMS flow revenue comes from first time buyers, so in these benchmarks SMS flows are doing more to win the first order than to bring customers back. Plan SMS as a conversion tool first and a retention tool second.
The mistake is using owned channels as cheaper broadcast ads. A discount blast may produce revenue today and train the list to wait for the next markdown tomorrow. A useful flow responds to behavior: what the shopper browsed, bought, rejected, reviewed, returned, or asked.
The best owned channel programs are built around moments: the first visit, the first purchase, delivery confirmation, product education, the review request, replenishment timing, category expansion, a loyalty milestone, and the win back trigger. Each moment should increase the chance of a second profitable action. That is the whole game.
Conversion work multiplies every channel because a fixed checkout lifts revenue from paid, organic, email, and direct traffic at the same time. Buying more traffic before fixing conversion leaks is the fastest way to make the leak more expensive.
Baymard Institute’s checkout research benchmarked 344 top grossing US and EU ecommerce sites and found that 65% have checkout UX that performs “mediocre” or worse. It also found the average site has 32 checkout improvements available, with a potential 35% conversion rate gain from better checkout UX. Those are not minor design preferences. Checkout friction changes the economics of every traffic source.
Baymard’s cart abandonment guidance identifies several preventable causes: 40% of shoppers abandon because extra fees like delivery and taxes appear too late, 18% because account creation is forced, and 20% because delivery is too slow. A brand can spend weeks improving ad creative while losing ready buyers to a surprise shipping fee. Fastlane’s guide to which website features calm anxious buyers ranks price, shipping, and returns visibility ahead of the other trust fixes, which is a sensible order to work in.
Revenue optimization should start with the parts of the journey closest to money: product page clarity, size, fit, or compatibility guidance, shipping and returns visibility, payment options, cart reassurance, guest checkout, delivery estimates, error handling, post purchase upsells, and subscription or replenishment prompts. Small improvements near checkout can outperform larger gains at the top of the funnel because the visitor has already shown intent.
The same logic applies to average order value. Bundles, threshold based free shipping, relevant cross sells, product education, and post purchase offers can increase revenue without raising traffic costs. The key word is relevant. A random add on at checkout can distract. A useful add on connected to the product can improve both order value and customer experience.
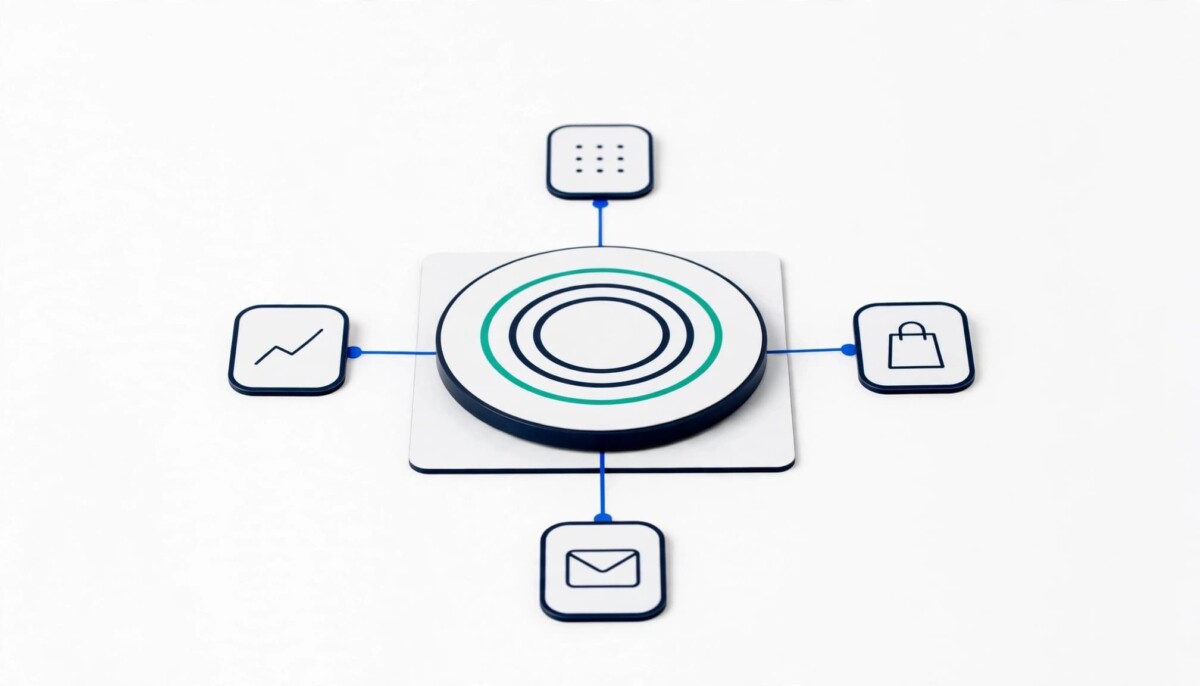
A revenue operating system is a weekly review where every channel reports against the same numbers, so each one can improve the next. Multichannel growth compounds only when the channels share information.
Paid search reveals high intent terms. Organic content answers the questions behind those terms. Product data helps platforms and shoppers understand the catalog. Email and SMS respond to behavior. Loyalty and referrals reward repeat action. Checkout analytics shows where money disappears. None of that works if every channel reports success in isolation.
The operating calendar should combine platform changes, customer data, merchandising plans, and eCommerce industry news with weekly revenue reviews. That way, the team reacts to market shifts without chasing every trend that appears in the feed.
A simple weekly scorecard can cover six areas:
This is where revenue optimization moves beyond traditional ads. The goal is not to replace paid media with one magic channel. It is to make every channel improve the next one. A paid campaign should create customers the owned program can retain. A product page should produce data the feed can reuse. A review should improve conversion and search visibility. A checkout improvement should lift revenue from every traffic source. Fastlane’s walkthrough of turning a struggling Shopify store into a 10X revenue brand shows how conversion rate, average order value, acquisition cost, and repeat purchase rate influence one another in a labelled composite example.
Start with the channel closest to money that you can measure this month, then add the next one only when the first is stable. Sequencing matters more than coverage, because a half built system in five channels compounds nothing.
If you are under roughly $500K in annual revenue, build one welcome flow and one post purchase flow, and fix shipping cost visibility before you raise ad spend. Those two changes need no new tools beyond the email platform you already pay for. If you are between roughly $500K and $2M, add the scorecard above and connect repeat purchase and margin to your acquisition reports, because this is the stage where extra apps, channels, and tactics most often arrive before the fundamentals are solid. If you are above that range and already run lifecycle, conversion, and feed work, the gain is usually in shared measurement: make sure the team that owns email and the team that owns paid are reading the same customer lifetime value.
Skipping a step is a choice with a cost. Adding a sixth channel while the checkout still hides shipping fees is the same mistake as buying more ads before the page converts. The brands that win do not stop advertising. They stop asking ads to solve problems created elsewhere. Revenue compounds when the whole system learns from every order.
Revenue optimization beyond ads is the work of raising profit per customer through everything that happens after a click, not by buying more clicks. It covers product data quality, checkout friction, email and SMS flows, retention, and shared measurement across channels. Paid ads still introduce new customers, but the other channels decide whether those customers become profitable. The practical shift is to judge each channel on contribution margin, repeat purchase, and customer lifetime value instead of first click return on ad spend alone, so a slightly costlier customer who buys again counts as a win.
Your paid ads are profitable beyond ROAS when the customers they bring in earn back more contribution margin than they cost to acquire over their first few orders. Connect each channel and creative to margin, refund rate, repeat purchase, and customer lifetime value, then compare LTV to CAC. Yotpo’s benchmark analysis treats a ratio below 3:1 as unstable. Also check the cash payback period, because a healthy ratio that pays back slowly can still strain cash. Start with one channel and one cohort of customers, and read the results after a second order has had time to happen.
Build email flows first, because they respond to behavior and carry the strongest revenue benchmark among owned channels. Klaviyo’s 2026 data shows flows producing nearly 41% of email revenue from 5.3% of sends. Start with a welcome flow and a post purchase flow, then add replenishment and win back flows as your catalog and data allow. Add SMS after email is working, and plan it around timely, permission based messages. In Klaviyo’s SMS benchmarks most flow revenue comes from first time buyers, so SMS tends to help conversion before it helps retention.
Checkout friction can cost a large share of potential conversions, though the exact amount varies by store. Baymard Institute’s benchmark of 344 top grossing sites found 65% have mediocre or worse checkout UX, and estimated a potential 35% conversion rate gain from better checkout design. Its cart abandonment research attributes 40% of abandonment to extra fees appearing late, 18% to forced account creation, and 20% to slow delivery. Treat those as directional, since your own store’s data matters more. Show shipping costs and delivery estimates early, offer guest checkout, and measure what changes.
A weekly ecommerce revenue scorecard should include contribution margin by acquisition channel, organic clicks and product feed errors, product page and checkout conversion rate, flow revenue and unsubscribe rate, time to second order, and the LTV to CAC ratio with cash payback period. Keep it to one page that the whole team reads together. The point is not more reporting, it is shared numbers. When paid, email, merchandising, and site teams look at the same scorecard, a checkout fix or a new flow shows up as a change in every channel instead of being claimed by one.