Every Shopify brand above a certain scale has the same problem. It’s not a data problem. It’s a time problem.
The data exists. It’s in your Shopify admin, your email platform, your ad accounts, maybe your analytics tool. You know in theory that if you could get it all in front of you in the right format, you could make better decisions.
For most Shopify merchants, the bottleneck isn’t access to data — it’s the 30-to-90 minutes of manual work required to answer a single business question. Stephanie DiSturco at Soft Services described her weekly ritual as toggling between tabs just to figure out why one metric moved. Segments AI collapses that from hours to seconds.
At Tresl, we’ve analyzed customer data for hundreds of Shopify merchants — and this pattern shows up constantly.
But actually getting it there? That’s an hour of your day you don’t have. So the question goes unanswered. The decision gets made on intuition. The weekly report gets built the same way it was built last week, with the same five KPIs, because those are the ones that are already automated.
Stephanie DiSturco at Soft Services said something I think about a lot.
She was describing her weekly reporting ritual — the one where she’s toggling between tabs, cross-referencing numbers, trying to figure out why a specific metric moved. “It feels silly. Even when I’m doing weekly reporting, I’m like, oh, why did my Google conversions go down? I should just be able to ask it why.”
That’s exactly right. And the fact that it felt silly to her is important. She wasn’t asking for a complicated feature. She was pointing at something obvious: the data is sitting there, the question is in her head, and there’s no direct path between the two.
Instead, there’s a ritual. Open this tab, export that file, filter by this date range, find the column, copy it into a spreadsheet, compare it to last week. Twenty minutes to answer a question that should take twenty seconds.
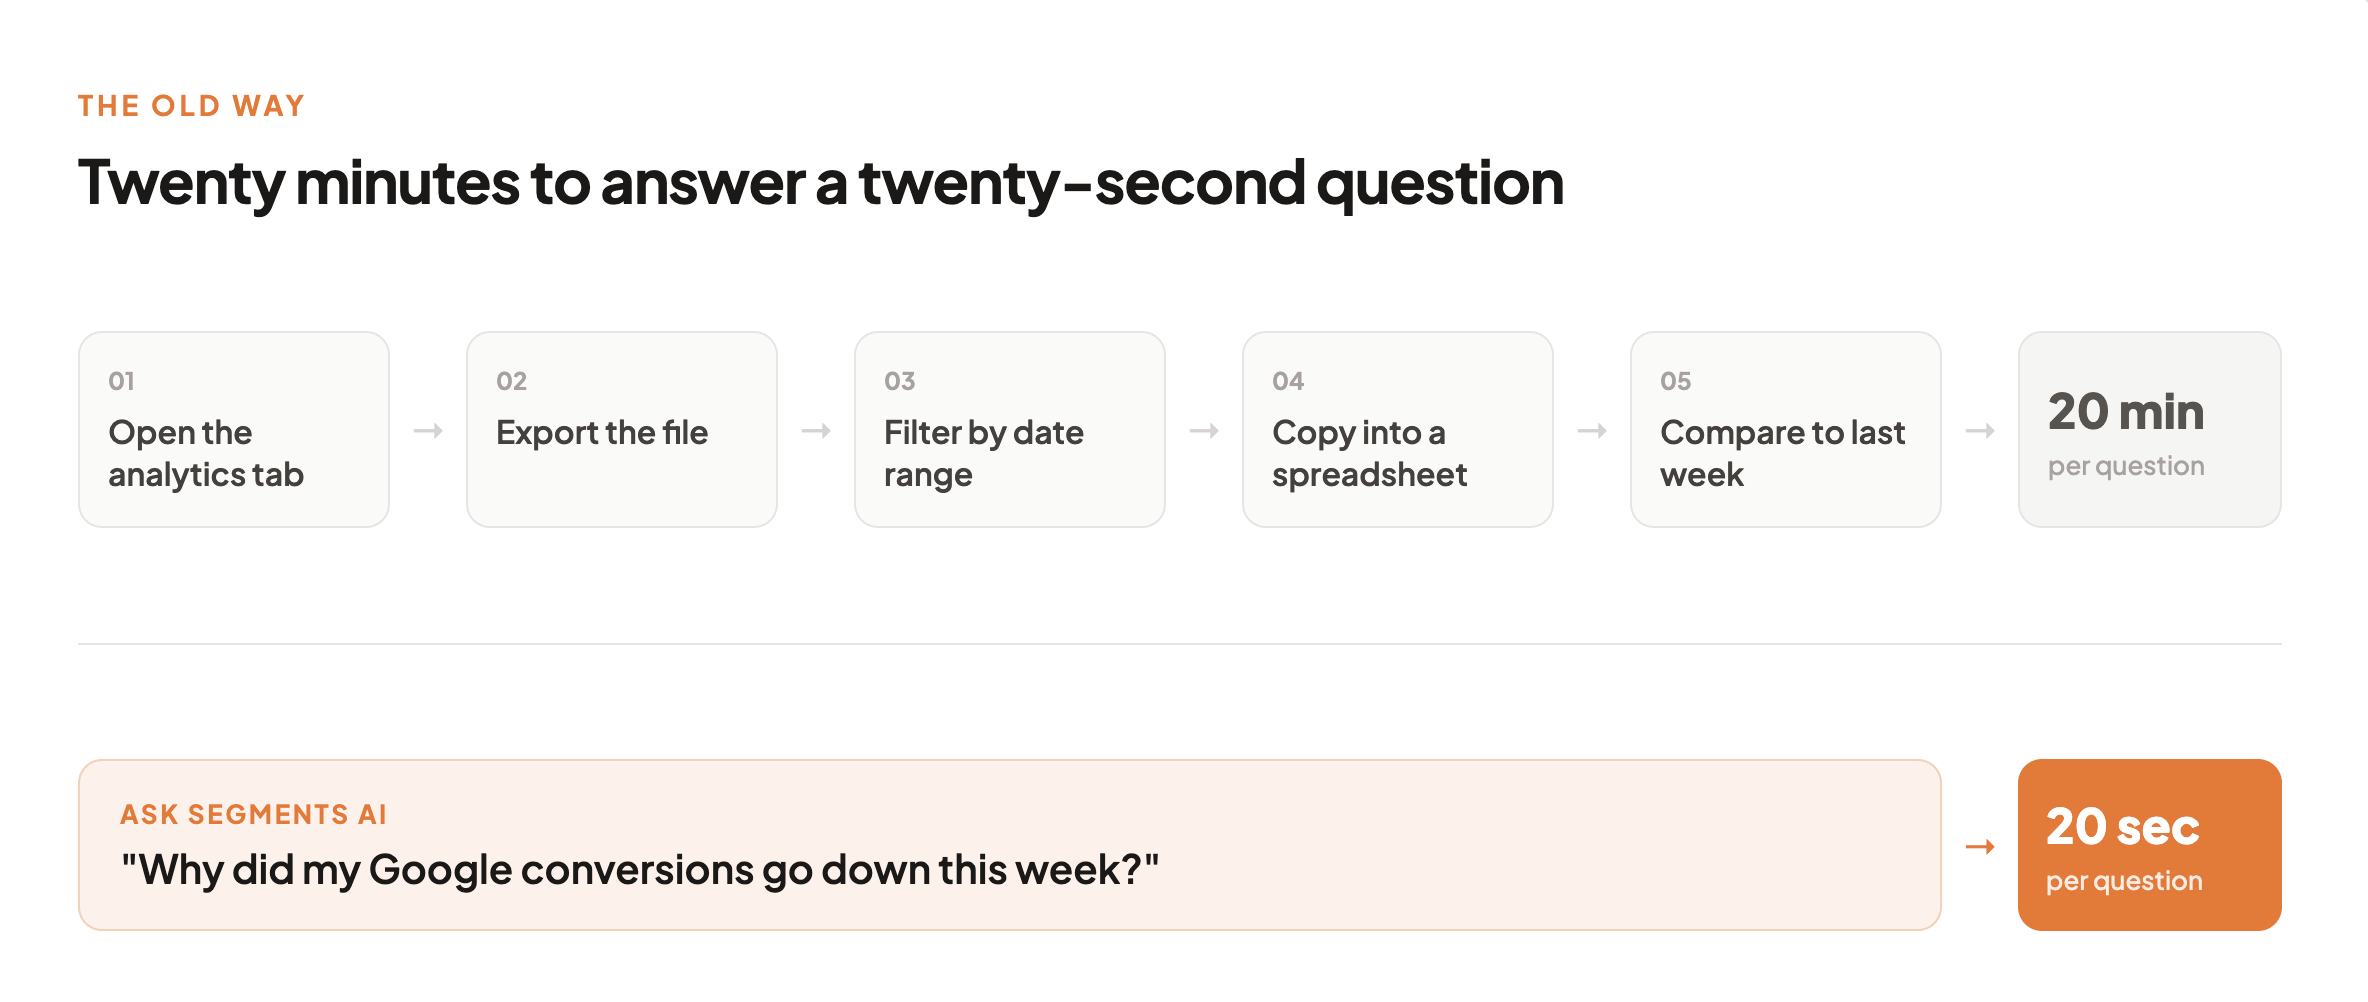
The question doesn’t even require deep analysis most of the time. “Why did Google conversions drop this week?” is a lookup plus a pattern match. It’s not a research project. It just gets treated like one because the tools require you to do it manually.
Brandon Erickson manages campaigns for seven fashion brands through Contra Visual. Every week, his team needs current KPIs for each brand: repeat rates, email performance, segment sizes, revenue by cohort.
The way they were getting those numbers was exactly what you’d expect: logging into each brand’s analytics, pulling the numbers, copying them into Excel. Seven times. Every week.
The hours add up. The errors add up. And the real cost isn’t just the time — it’s that by the time the numbers are assembled and the report is built, the week is already partially gone. Decisions that could have been made Monday on fresh data get made Wednesday on data that was assembled by hand on Tuesday afternoon.
Brandon wasn’t asking for something magical. He needed to answer the same ten questions for seven different brands on a consistent weekly cadence. That’s a reporting problem dressed up as a strategy problem. And it ate his team’s time every single week.
Laura Cantor had 11 million customer profiles to manage. Her description of her weekly data process — “watching the ship sink” — wasn’t a complaint about the data. It was a complaint about the effort required just to understand what was happening.
At that scale, any meaningful segment is numerically significant. At-risk customers, second-purchase prospects, high-CLV lapsers — these are large cohorts worth real budget decisions. Interrogating them required dedicated data work every single time.
Most brands that size don’t have a BI team. They have a marketing manager, a Klaviyo account, and a Shopify admin. The data is there. The infrastructure to interrogate it fast is not.
This is what AI chat mode actually does in practice. Not a dashboard. Not another visualization layer. A question.
“What’s my 90-day repeat rate for customers acquired in November?”
“Which segment has the highest predicted CLV right now?”
“How many customers are in the second-purchase window — bought once, no repeat in 30 to 60 days?”
Each of those questions, asked the old way, is a 30-to-90-minute project. You need to know which table to query, or which report to pull, or which export to run. You need to clean the data. You need to cross-reference something else. You need to build the filter.
Ask it in Segments AI, and you get the answer in the time it takes to finish typing the question.
Stephanie doesn’t need to spend her Monday morning on a five-tab reporting ritual. Brandon doesn’t need to manually assemble seven brand dashboards into one spreadsheet. Laura doesn’t need to watch the ship sink — she can just ask where the ship is going.
The data was never the bottleneck. It was always the time. And the question is no longer how to get better data — it’s how to stop paying an analyst-sized tax on every question you already know how to ask.
If you want to ask your own customer data questions like this, try Segments AI free — no SQL, no dashboards, just ask.