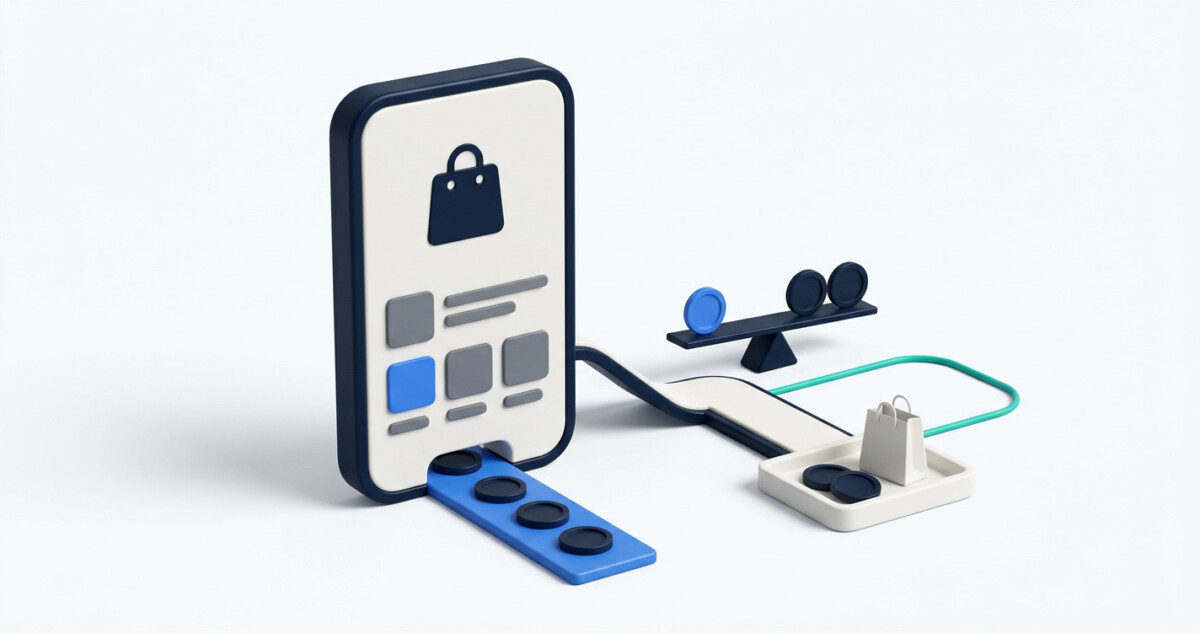
Mobile app user acquisition pays for most Shopify brands only after the app is filled with existing customers and its repeat rate is measured. Owned channels fill the app almost free; paid installs earn a test once cost per first buyer sits below 90 day contribution.
A $3 install is not a customer. At a 10% first purchase rate it is a $31 customer, and your margin has to cover that before anyone celebrates the cheap installs.
North American shopping apps paid a median $3.12 per install in the first half of 2026, up 14% on the year. That number is now arriving in Shopify founders’ inboxes inside pitch decks, usually next to a chart showing app shoppers converting two or three times better than mobile web, and an offer to fill the app with fresh users.
The chart is usually true and almost always misleading. A Shopify brand’s app is populated by people who already bought, already saved a card, and already said yes to push notifications. Paid installs bring in strangers. Strangers behave like strangers, and the question that decides whether the campaign works is not the install price. It is what happens between the install and the second order. That is the standard any Mobile User Acquisition program should be held to: the buyers it brings in after the install, not the install count.
If you are running a branded app on a no-code app builder and someone is quoting you install volume, this piece gives you the arithmetic to answer them. If you are a $500K brand wondering whether to launch an app and buy users for it, it gives you a reason to wait, and a clear signal for when to stop waiting.
Your Shopify app should fill from customers you already have, because a brand app is a retention channel first and every install from your own list costs close to nothing. We made this case in September when looking at when a custom mobile app build beats an app builder subscription, and it holds for acquisition too: the app gives you a direct line to buyers you have already paid to acquire once. Paying a second time to acquire strangers into that channel is a different business with different maths.
Look at what the app itself costs before any marketing. The Tapcart listing on the Shopify App Store currently shows paid plans at $500, $1,250, and $2,850 a month. A brand on the entry plan is spending $6,000 a year to keep the app live. Illustrative example, assuming 2,000 existing customers install it from a post purchase email over a year: that is $3 per installed customer, roughly the same as one paid install in North America, except every one of those people has already bought from you.
The owned channels that fill an app are unglamorous and they work. Put the download ask on the order confirmation page, in the shipping notification, on a QR card in the box, in a smart banner on mobile web, and as a one time SMS to your most engaged buyers. Give app users something real in exchange: early access to drops, saved sizes, faster reorder. When Tapcart’s founder Eric Netsch came on the podcast to talk about why owning the mobile shopping experience end to end matters, the point was control of the relationship with customers you already have, through real time communication. That is the job.
The pattern I watched during my years at Shopify is relevant here. The merchants who stalled between $500K and $2M almost never stalled from a missing channel. They stalled from premature complexity: a new channel switched on before the existing one was full. A paid install campaign pointed at an app that your own customers have not adopted yet is a textbook case.
The 2026 shopping app data says paid installs are carrying more of the growth while getting more expensive in North America, which is exactly why the pitch is landing now. Adjust’s shopping app insights report for 2026 covers thousands of apps between January 2024 and June 2026, and the headline findings were summarised in Martechvibe’s coverage of the report’s paid acquisition figures.
Three numbers matter for a Shopify operator. The global ratio of paid to organic installs reached 0.72 in the first half of 2026, up 26% from 2025 and 47% from 2024, and shopping apps ran higher still at 0.76. North American shopping app installs grew 46% and sessions grew 26%. And North America remained the most expensive region at $3.12 per install, up 14%, against a global median of $1.08.
Read those together and the story is clear: more of the category’s install growth is being bought, and the price of buying it in your home market went up. Adjust’s Americas regional vice president made the same point in plainer words, that acquisition is getting pricier and paid installs are doing more of the lifting.
Now the caveat that the pitch deck will not include. These benchmarks describe shopping, marketplace, and deal discovery apps as a category, which means the averages are shaped by large multi brand retailers and marketplaces whose catalogues, purchase frequency, and brand awareness look nothing like a single DTC brand’s app. A marketplace can buy an install and sell that user anything in a catalogue of millions. Your app sells your catalogue. Use the $3.12 as a realistic input for cost, not as evidence that the economics behind it transfer to you.
The useful takeaway is narrower: if you test paid installs in North America, budget for roughly $3 per install as a starting assumption, and judge everything that follows on purchases.
Cost per install means nothing until you divide it by your install to first purchase rate and compare the result with what a buyer contributes in their first 90 days. That single conversion is the whole test. Everything else in a paid app campaign is a way of moving one of those three numbers.
Here is a worked illustration. It is hypothetical, built on stated assumptions, and you should replace every input with your own. Assume a $3.12 cost per install (the North American median above), a $65 average order, a 40% contribution margin after product, shipping, and payment fees, and a 35% chance that a new buyer places a second order within 90 days. Each order contributes $26. A new buyer’s expected 90 day contribution is $26 plus 35% of a second $26 order, which comes to $35.10.
The breakeven line in this example sits at roughly 9% of paid installs placing a first order within the measurement window: $3.12 divided by $35.10. Below that, every buyer you acquire costs more than they return in 90 days. Above it, the campaign funds itself and the second and third orders become profit.
Two inputs swing this table more than any channel choice. The first is your repeat rate, which is why the work in a Shopify retention framework built around the second purchase comes before paid installs, not after. Lift the 90 day repeat rate from 35% to 50% and the breakeven install rate drops to about 8%. The second is the install to first purchase rate, which you can only learn from your own app. Do not borrow a benchmark for it. Run a small test, measure it, and let the table tell you whether to scale.
On iOS, Apple’s AdAttributionKit decides what your ad networks can see, and it reports conversions as privacy protected postbacks rather than user level purchase data. Apple’s developer documentation describes a framework available from iOS 17.4 in which an ad network signs an ad, a person installs or reengages, and the advertised app updates a conversion value as that person engages. The system can send postbacks across three conversion windows, and Apple sets a data tier for each conversion to protect crowd anonymity, which limits how much detail the network receives.
Two details in that documentation matter to a Shopify brand. Apps do not need App Tracking Transparency permission before calling the attribution APIs, so measurement does not depend on a shopper tapping allow. And the framework handles reengagement as well as installs, which means you can measure campaigns that bring lapsed app users back, not only campaigns that win new ones. Apple also states that AdAttributionKit interoperates with its older SKAdNetwork, with only one impression winning the conversion.
The practical consequence is that your app must tell the system when a purchase happens, or your ad networks will optimise toward installs because installs are all they can see. Before any paid spend, ask your app builder and your measurement partner three questions. Does the app update the conversion value when a first purchase completes? Is first purchase the event mapped into the earliest conversion window? And who reconciles the networks’ reported purchases against Shopify orders tagged to the app sales channel?
Android measurement works differently, and your partner should explain both platforms side by side rather than reporting a single blended number. If nobody on your side can answer those questions yet, that is the finding. A campaign that cannot see purchases will buy the installs that are cheapest to buy, and those are rarely the users who order twice.
Bring in a mobile user acquisition partner once your app has a measured repeat rate, purchase events flowing into attribution, and enough budget to test several sources without betting the quarter on one. Before that point, a small in house test through the app campaign types inside Meta and Google is enough to learn your install to first purchase rate, and learning that number is the only goal of the first test.
After that point, a specialist team can add things a stretched in house marketer usually cannot: access to in app networks and programmatic sources beyond the two big platforms, fraud filtering at the source level, creative produced fast enough to replace fatigued ads, and cohort reporting by channel. A specialist partner earns its fee when it judges every source on what users do after the install rather than on install volume, which is the only frame that makes sense for a Shopify brand whose meaningful events are a first purchase and then a repeat order.
The questions that separate a fit from a pitch are specific. Ask for cohorts from ecommerce or retail apps, not gaming, finance, or betting, because a deposit and a repeat order are different behaviours. Ask whether you will see every source and placement, and what it cost, rather than a blended rate. Ask what they will report against: if the answer is cost per install, keep looking; if it is cost per first purchase and 90 day payback, keep talking. And ask how they scale, because the right answer is one source and one region at a time, with cohort payback confirmed before each budget step.
Hold the whole program to the same unit economics as the rest of your marketing. The 3 to 1 lifetime value to acquisition cost benchmark in our guide to ecommerce customer acquisition across owned and paid channels applies to app buyers exactly as it applies to web buyers. An app install campaign does not get a separate scorecard because the dashboard looks different.
The right app growth path depends on your revenue stage and your app’s measured repeat rate far more than on which ad network is cheapest this quarter. Hold your own numbers against this.
There is one honest exception to the caution in this piece. If you sell a high frequency consumable, such as coffee, supplements, or pet food on a monthly cycle, the 90 day window can hold two or three orders instead of one and a bit, and the breakeven install rate drops accordingly. Brands in those categories can justify a paid test earlier than the table suggests, provided the subscription or replenishment flow already works on mobile web.
The opposite case deserves the same honesty. If you sell considered purchases bought once or twice a year, an app is a weak acquisition surface at any price, because the people most likely to install it are the ones least likely to need it again soon. Put that budget into the channels that reach first time buyers on the web and let your app serve the customers who do come back.
Whatever your stage, the sequence stays the same: fill the app from your own customers, measure what they do, map the purchase event, run a small test, and only then decide whether outside volume is worth buying.
In North America, expect around $3 per install as a starting assumption for a shopping app in 2026. Adjust’s 2026 shopping app report put the North American median at $3.12, up 14% on the year, against a global median of $1.08. That install price is not your real cost, though. Your real cost is cost per first buyer, which is the install price divided by the share of installs that place a first order. At a 10% first purchase rate, a $3.12 install becomes a $31.20 customer. Compare that number with what a new buyer contributes in their first 90 days, after product, shipping, and fees, before you approve any budget.
No, fill the app from your existing customers first and run paid installs only after you have measured how app users behave. A new app has no data on install to first purchase rate or repeat rate, which are the two numbers that decide whether paid installs pay back. Your email list, SMS subscribers, order confirmation page, and packaging can drive installs at almost no marginal cost, and those users show you how the app performs with people who already trust you. Once purchase events are tracked and you have a few months of cohort data, a small paid test tells you whether strangers behave well enough to justify scaling.
A good install to purchase rate is any rate above your own breakeven, which you calculate rather than borrow from a benchmark. Divide your cost per install by a new buyer’s expected 90 day contribution. With a $3.12 install and $35.10 of 90 day contribution, breakeven is about 9% of installs placing a first order. Published benchmarks mostly describe large retail and marketplace apps with huge catalogues and high frequency, so they rarely transfer to a single brand DTC app. Run a small test, measure the share of paid installs that buy within your measurement window, and compare it with your breakeven line.
No, Apple’s attribution framework works without App Tracking Transparency permission, but it gives you aggregated, delayed data rather than user level detail. According to Apple’s AdAttributionKit documentation, apps can call the attribution APIs regardless of a person’s tracking choice. The ad network receives postbacks across up to three conversion windows, with detail limited by a privacy tier Apple assigns. For a Shopify brand, the critical step is making sure the app updates its conversion value when a first purchase happens, so networks optimise toward buyers instead of installs. Ask your app builder and measurement partner to confirm that mapping before you spend.
Ask at the moments when customers are already paying attention, and give them a concrete reason to switch. The highest intent moments are the order confirmation page, the shipping notification email, a QR code card in the box, and a smart banner on your mobile site for returning visitors. Pair the ask with something only the app provides, such as early access to launches, saved sizes and payment details, or faster reordering. Send one SMS to your most engaged buyers rather than repeated blasts. These owned installs cost close to nothing beyond your app builder subscription and bring in the customers most likely to order again.